Nature, advance online publication on Wednesday, June 20'th 2012
 |
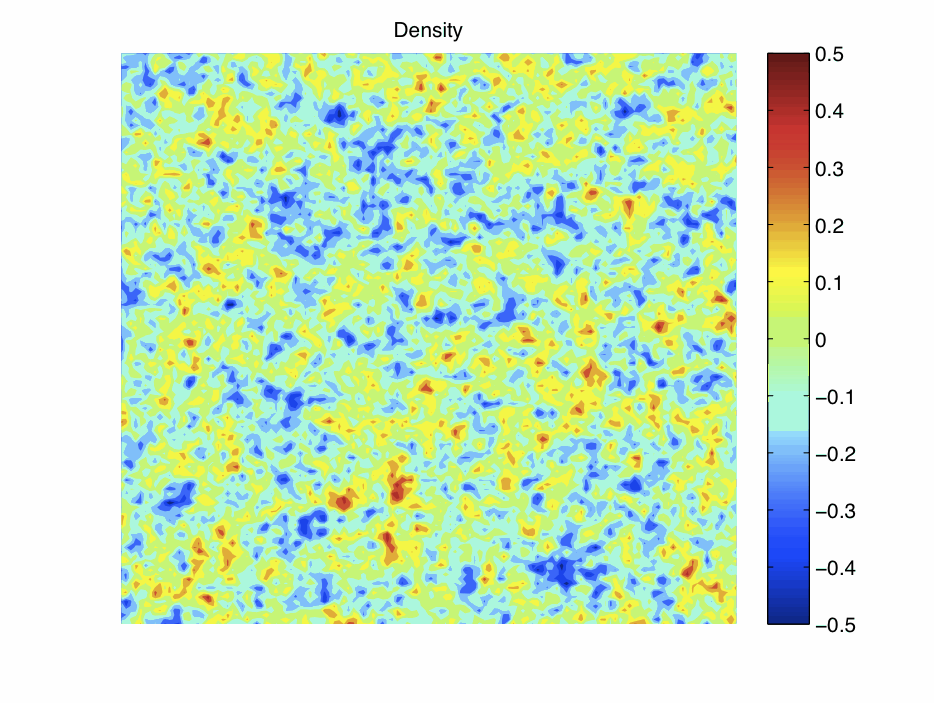
| The density of matter. Green regions are average, red regions are denser and blue regions are less dense (We show the overdensity, i.e., the density relative to the mean density, in units of the mean density; e.g., 0.5 means a density of 1.5 times the mean). Regions with a higher density than average form more stars, since gravity is enhanced throughout such regions, making it easier to form the dark matter concentrations in which gas collects and forms stars. |
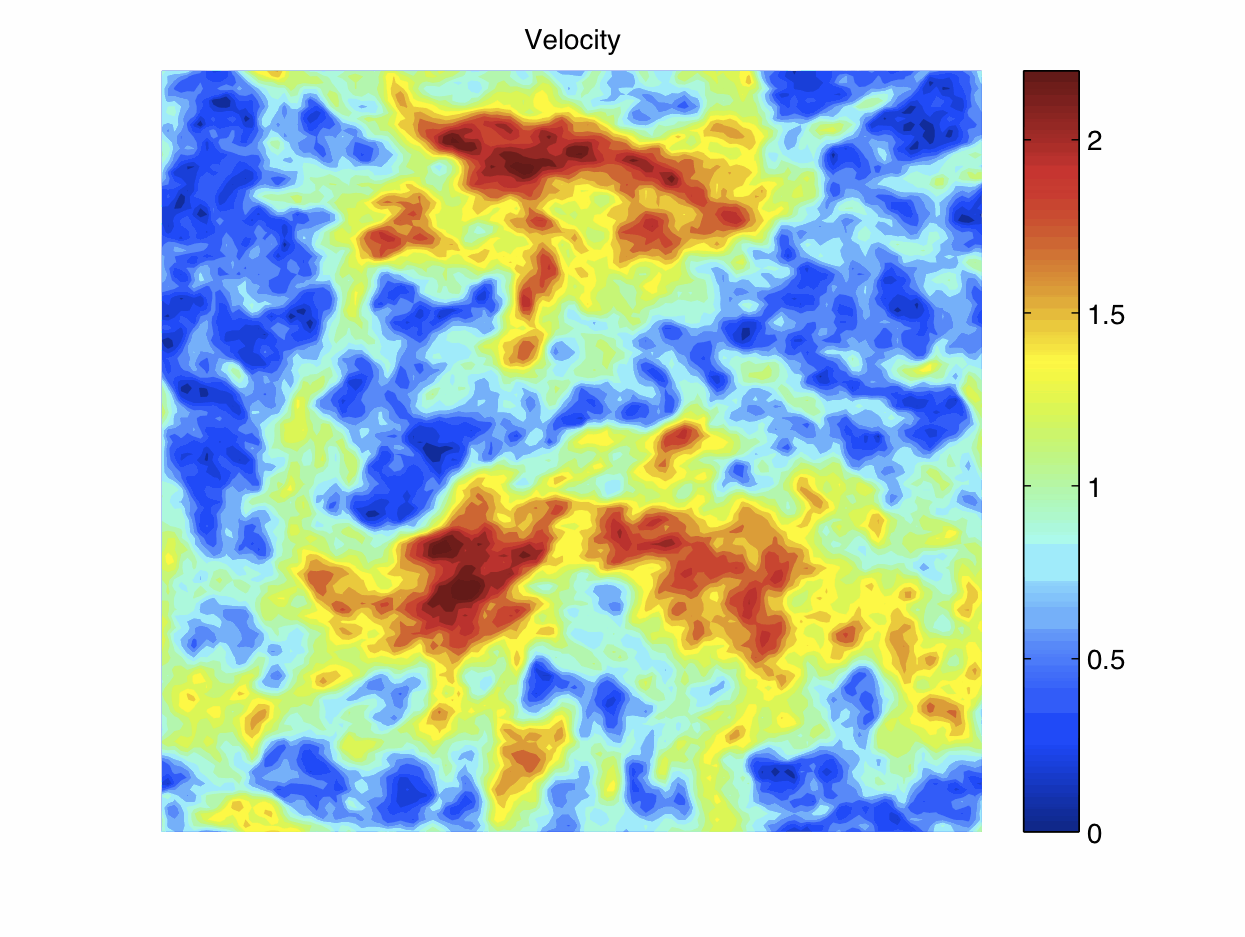 |
| The difference between the velocity of dark matter and that of ordinary matter (baryons, i.e., gas consisting of mostly hydrogen and heium). The velocity difference is small in the blue regions and large in the red regions (the relative velocity is given in units of its root-mean-square value). Comparing to the density image, the velocity shows coherent structure on much larger scales. Regions with a large velocity difference have fewer stars, since the gas moves rapidly and is not captured by the gravity of dark matter concentrations (where the gas must accumulate in order to form stars). |
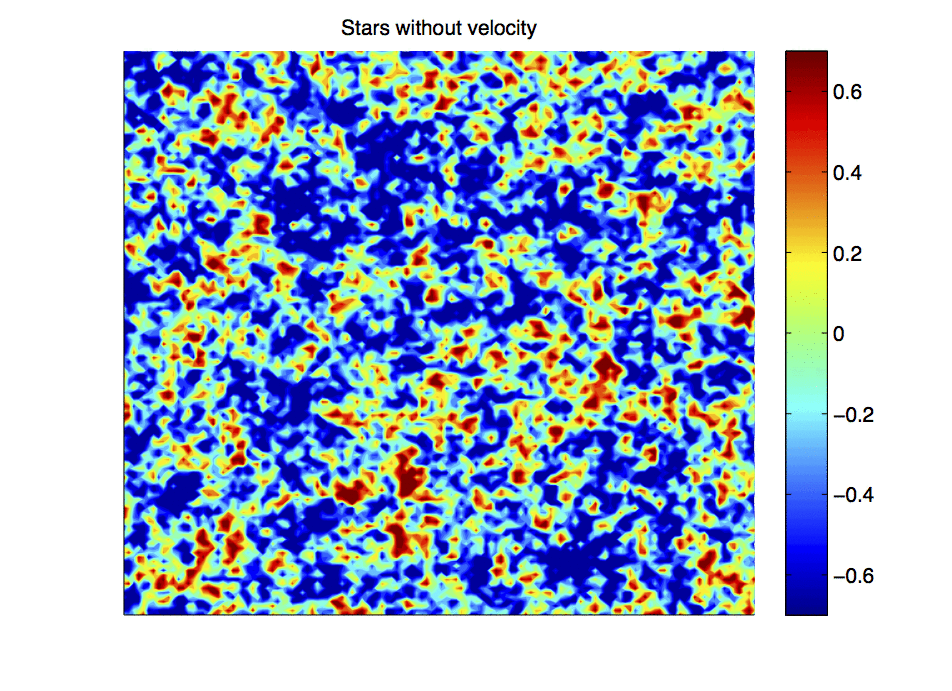 |
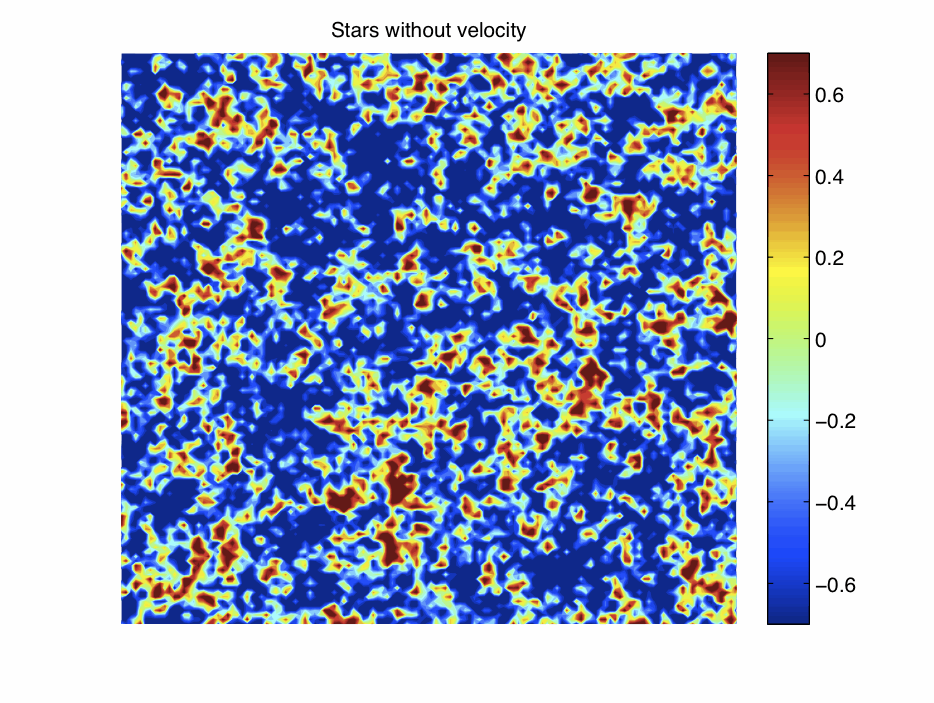
| The density of stars when the Universe was 180 million years old (i.e., at redshift 20). This shows the previous expectation, including the effect of density only (but not the velocity difference). The colors correspond to the logarithm of the gas fraction in units of its mean value (Here the mean fraction of all the gas which accumulates in star-forming mini-galaxies is 0.21%). |
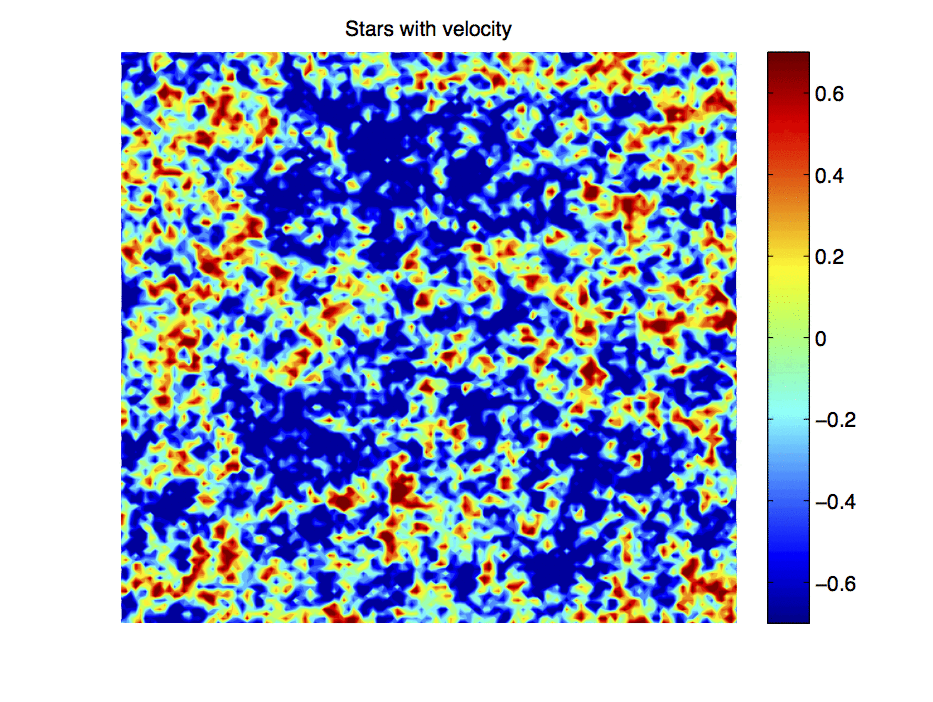 |
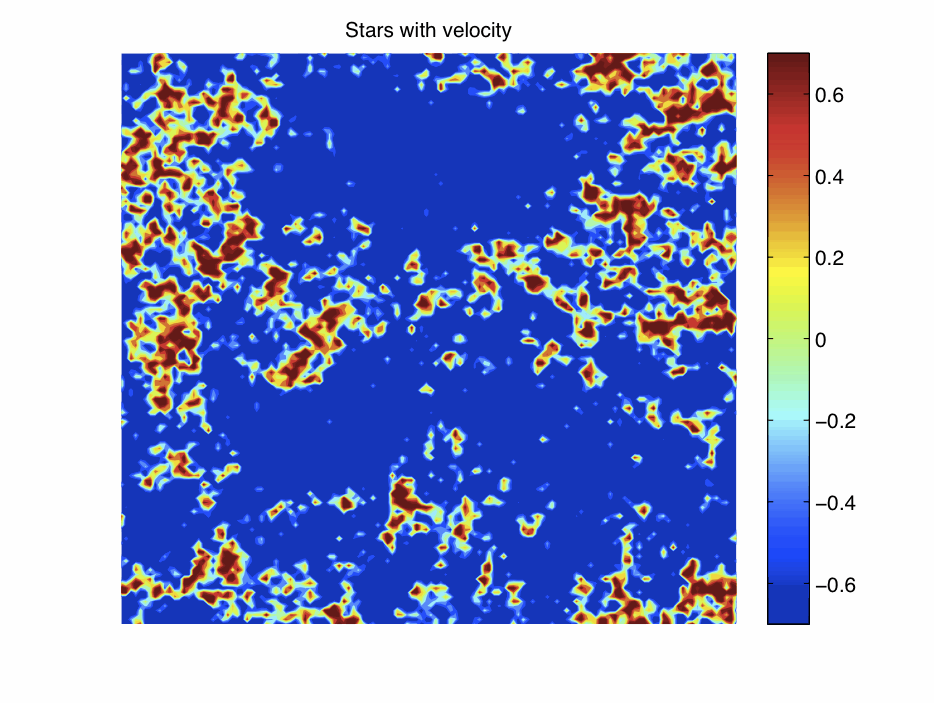
| The density of stars when the Universe was 180 million years old (i.e., at redshift 20). This shows the new prediction, including the effect of density as well as the velocity difference. Comparing to the distribution of stars as affected by density only, the velocity effect produces a more prominent cosmic web, i.e., larger coherent regions that have a low density of stars, separated by ribbons or filaments of high star formation. The colors correspond to the logarithm of the gas fraction in units of its mean value (Here the mean fraction of all the gas which accumulates in star-forming mini-galaxies is 0.12%). |
 |
| The density of stars when the Universe was 67 million years old (i.e., at redshift 40). This shows the previous expectation, including the effect of density only (but not the velocity difference). The colors correspond to the logarithm of the gas fraction in units of its mean value (Here the mean fraction of all the gas which accumulates in star-forming mini-galaxies is 1.1e-7). |
 |
| The density of stars when the Universe was 67 million years old (i.e., at redshift 40). This shows the new prediction, including the effect of density as well as the velocity difference. The effect of the velocity is even more striking at this earlier time, so it has a critical effect on our understanding of the environment in which the very first stars formed, but direct observations of such early times are not feasible in the near future. The colors correspond to the logarithm of the gas fraction in units of its mean value (Here the mean fraction of all the gas which accumulates in star-forming mini-galaxies is 1.5e-8). |
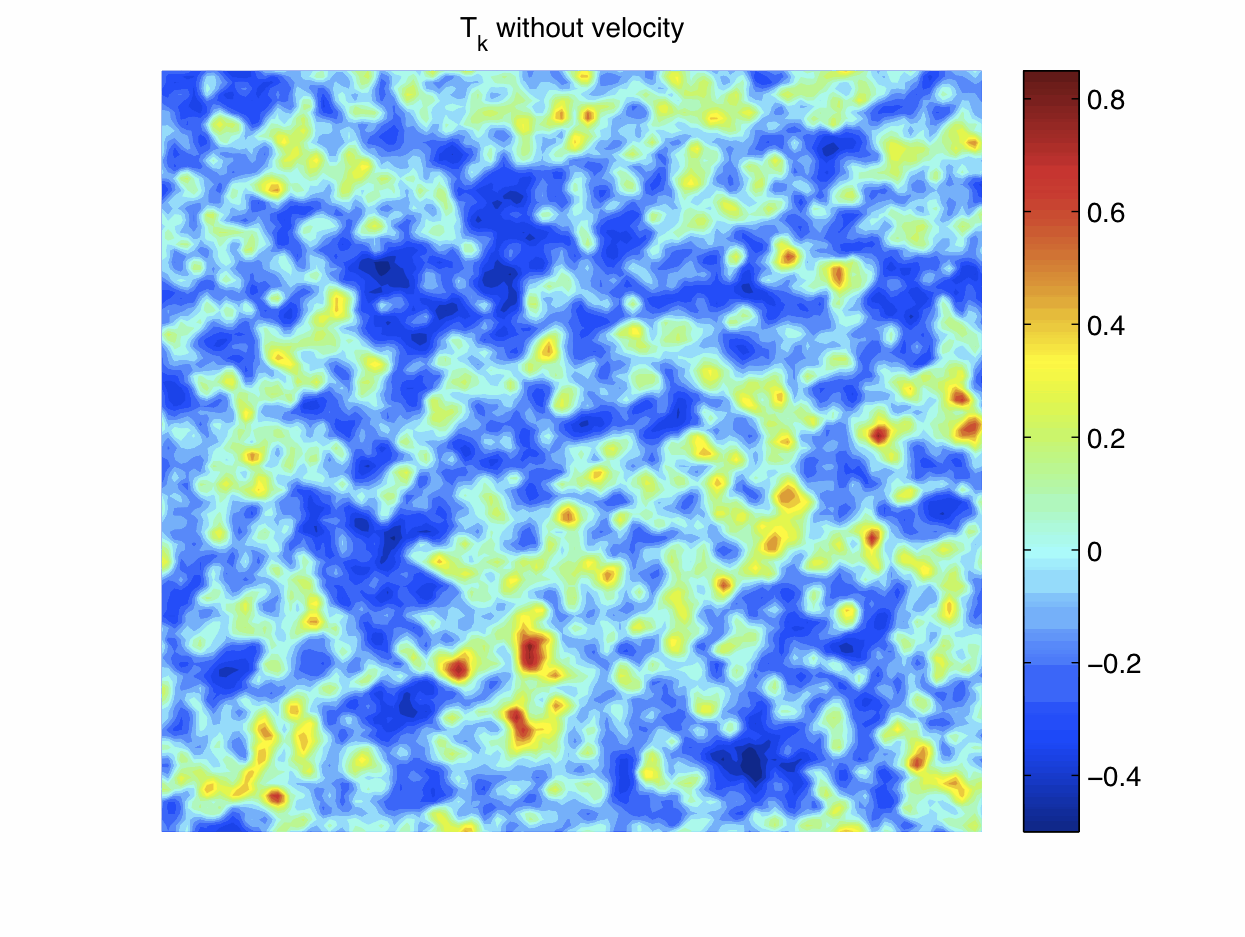 |
| The gas temperature when the Universe was 180 million years old. This shows the previous expectation, including the effect of density only (but not the velocity difference). The temperature is derived from the history of heating of the gas by the X-ray radiation emitted due to star formation in the surrounding galaxies (specifically, X-rays are expected from supernova explosions and the remnants of dead stars). X-rays typically travel (in every direction in 3 dimensions) up to around 100 Mpc (a quarter of the size of this image), so the gas temperature map smoothes out small-scale flucutations and brings out the large-scale distribution. Note that the intensity of X-rays from each star is normalized lower here by a factor of 1.5 compared to the velocity case, so that in both cases the mean gas temperature in the Universe equals the cosmic microwave background at the time shown here. The colors correspond to the logarithm of the gas (kinetic) temperature (in units of the temperature of the cosmic microwave background). |
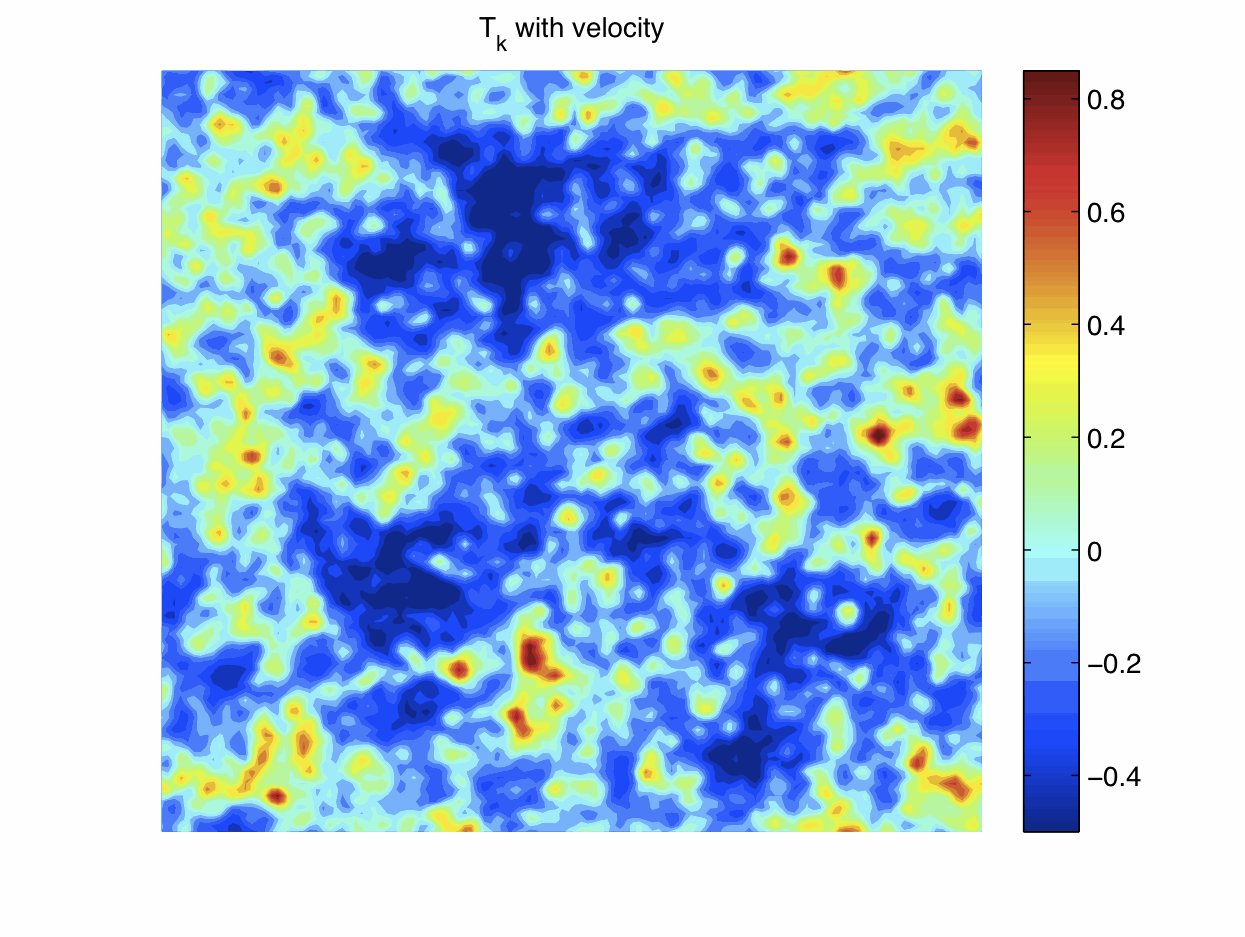 |
| The gas temperature when the Universe was 180 million years old. This shows the new prediction, including the effect of density as well as the velocity difference. For easy comparison, both cases (with or without the velocity) are normalized so that the mean gas temperature in the Universe equals the cosmic microwave background at the time shown here. Comparing to the other case, the distribution of stars with velocity produces larger coherent warm regions and, especially, larger cold patches in regions with a large velocity difference between the gas and the dark matter. The colors correspond to the logarithm of the gas (kinetic) temperature (in units of the temperature of the cosmic microwave background). |
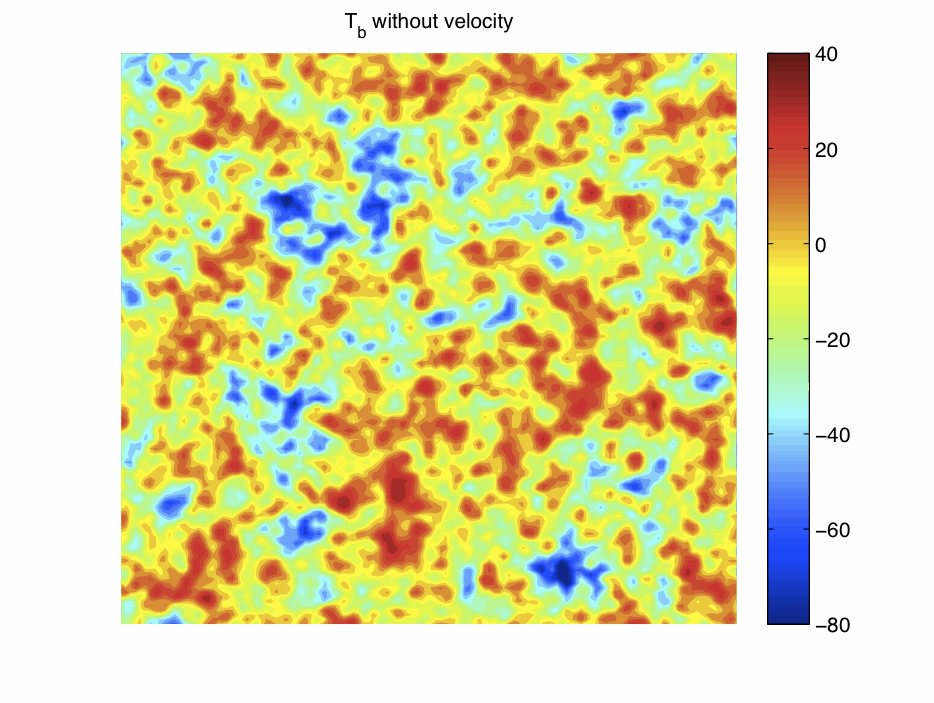 |
| The intensity of radio waves from hydrogen atoms at a wavelength of 21 cm, from a cosmic age of 180 million years. This shows the previous (density-only) expectation. Radio astronomers measure intensity in equivalent temperature units, and speak of the "brightness temperature" (measured here in units of millikelvin), which is simply proportional to the expected intensity of the observed flux. Gas that is hotter than the cosmic microwave background emits 21-cm radiation and has a positive brightness temperature, while colder gas absorbs 21-cm radiation and has a negative brightness temperature. Note that the actual observed wavelength is redshifted by the expansion of the universe to 4.4 meters (corresponding to a frequency of 68 MHz). |
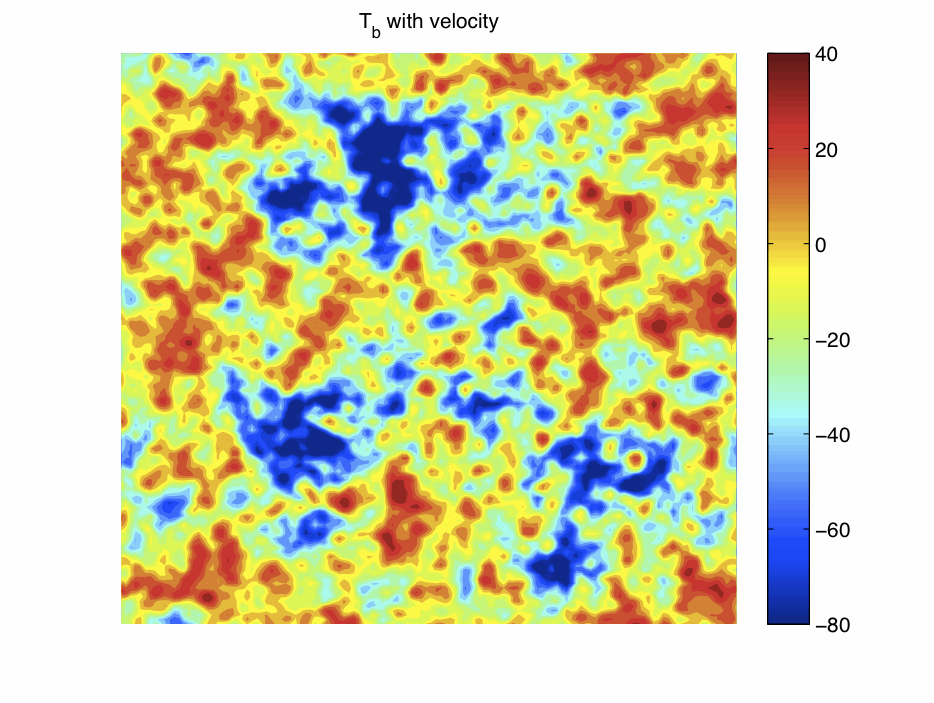 |
| The intensity of radio waves from hydrogen atoms at a wavelength of 21 cm, from a cosmic age of 180 million years. This shows the new prediction (including the effect of both velocity and density), in brightness temperature units of millikelvin. The 21-cm intensity mainly measures the gas temperature (though it is also proportional to the gas density). Regions with a high density of stars have had a higher intensity of X-rays, and thus are hotter and emit more intense 21-cm radiation. This image highlights cold spots, since cold gas absorbs particularly strongly. While such maps may actually be measured sometime in the future, more immediately feasible is to measure the statistical properties of the fluctuations, which can be done even in noisy maps. The velocity effect should produce a much stronger fluctuation signal, making it easier to detect, and the signal should carry a signature of the effect of the cosmic microwave background on the gas from when the Universe was less than 400,000 years old (for details see the Nature paper, in particular Figure 4). |