Images: Nature: Late Heating
The observable signature of late heating of
the Universe during cosmic reionization
Anastasia Fialkov (Tel Aviv University; École Normale Supérieure,
Paris)
[link], Rennan Barkana (Tel Aviv University)
[link], Eli Visbal (Columbia University; Harvard University)
Nature, advance online publication on Wednesday, Feb. 5'th 2014
(in print Thursday, Feb. 13'th).

More details and related images
The formation of stars is a part of our cosmic history. Astronomers
know that long before there were stars, the early Universe was filled
with a hot, very uniform gas. In contrast, today we see a complex
Universe of stars and galaxies. A great unknown frontier is the era of
the formation of the first stars, which marked the transformation of
the Universe to its current state. Currently, the most distant
detected galaxies are from a cosmic age of around 700 million years,
and it is very difficult to go much earlier with detections of
individual galaxies. Since the Universe was filled with hydrogen atoms
at those early times, the most promising method for observing the
epoch of the first stars is using the prominent emission of hydrogen
at a wavelength of 21 cm (corresponding to radio waves).
The intensity of the emission by hydrogen is affected by the
surrounding stars. In particular, massive stars emit energetic
ultra-violet radiation that breaks up ("ionizes") hydrogen atoms that
it hits. This creates bubbles that are nearly empty of hydrogen atoms
(and thus of 21 cm emission) around the early galaxies. A second major
effect comes from stellar systems called X-ray binaries, especially
black-hole binaries. These are binary stars in which the more massive
star ended its life with a supernova explosion that left a black-hole
remnant in its place; gas from the companion star is pulled in towards
the black hole, gets ripped apart in the strong gravity, and produces
high-energy (X-ray) radiation. This radiation reaches large distances,
and is believed to have caused the first substantial heating of the
cosmic gas (after it had cooled down as a result of the cosmic
expansion).
It has been firmly believed that the heating occurred very early, so
that by the time of reionization, all the gas was already hot. In this
case, the hydrogen gas emitted brightly in the radio everywhere,
except in the ionized bubbles (where there are no hydrogen atoms). The
result is a clear expectation for a 21 cm signal driven by
reionization: uniform intensity initially, increasing spatial
fluctuations as the ionized bubbles grow, with the emission finally
disappearing as all the gas becomes ionized. We have discovered,
however, that this standard picture depends sensitively on the
spectrum (energy distribution) of the heating X-ray
radiation. Previously it has been assumed that most of the X-rays come
out at relatively low energies (below 1 keV: the energy gained by an
electron moving through 1000 Volt); however, accumulating data on the
radiation from X-ray binaries shows that high-energy X-rays actually
dominate. We find that this substantially changes the expectations for
cosmic heating.
One consequence is that the heating is substantially
delayed. High-energy X-rays typically travel a long distance, over a
long time, before their energy is absorbed and heats the gas. As a
result, the heating should still be underway during cosmic
reionization, with the gas still cold in some areas. Unlike the
previous prediction, the observed pattern of 21 cm emission of
hydrogen should still be affected by the distribution of gas
temperature as well as by the ionized bubbles of reionization.
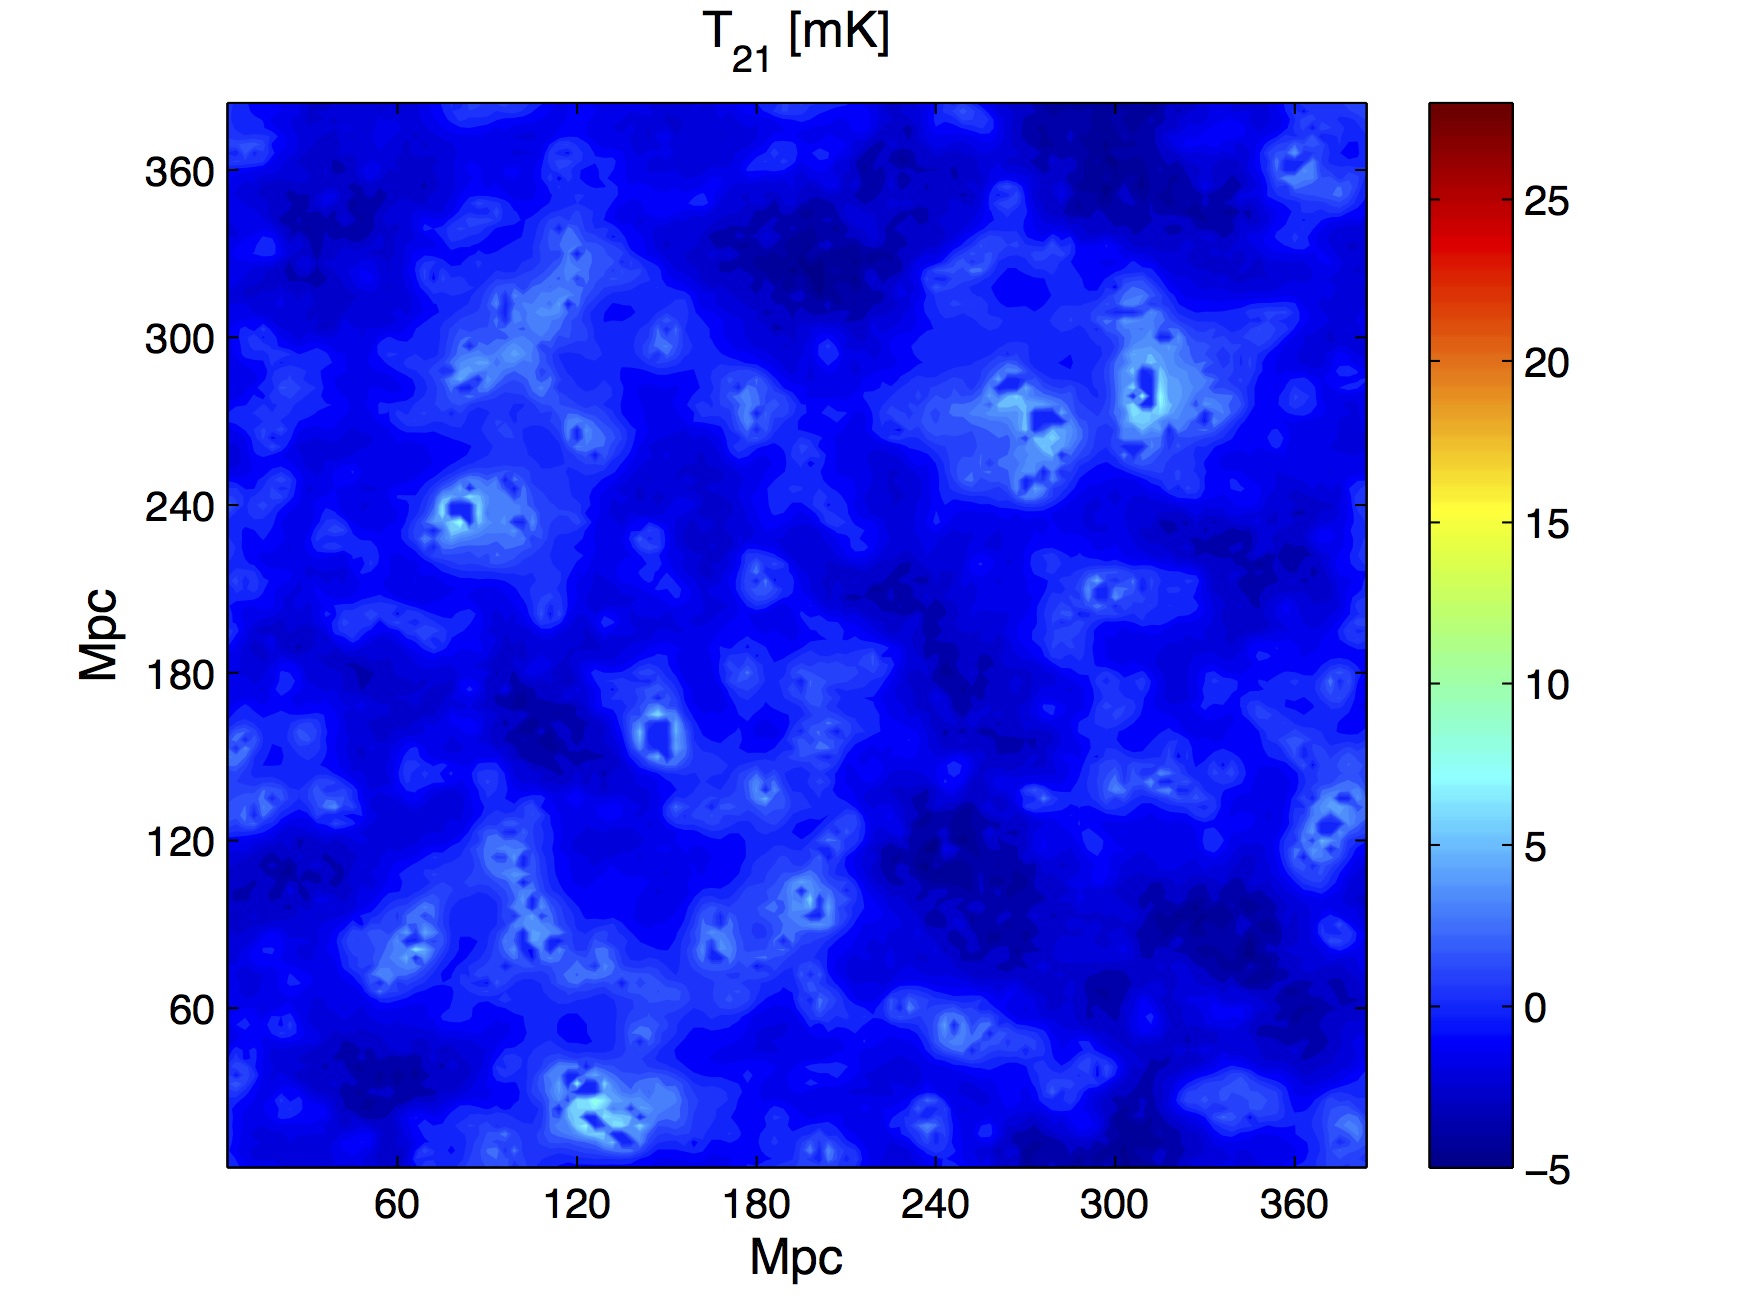
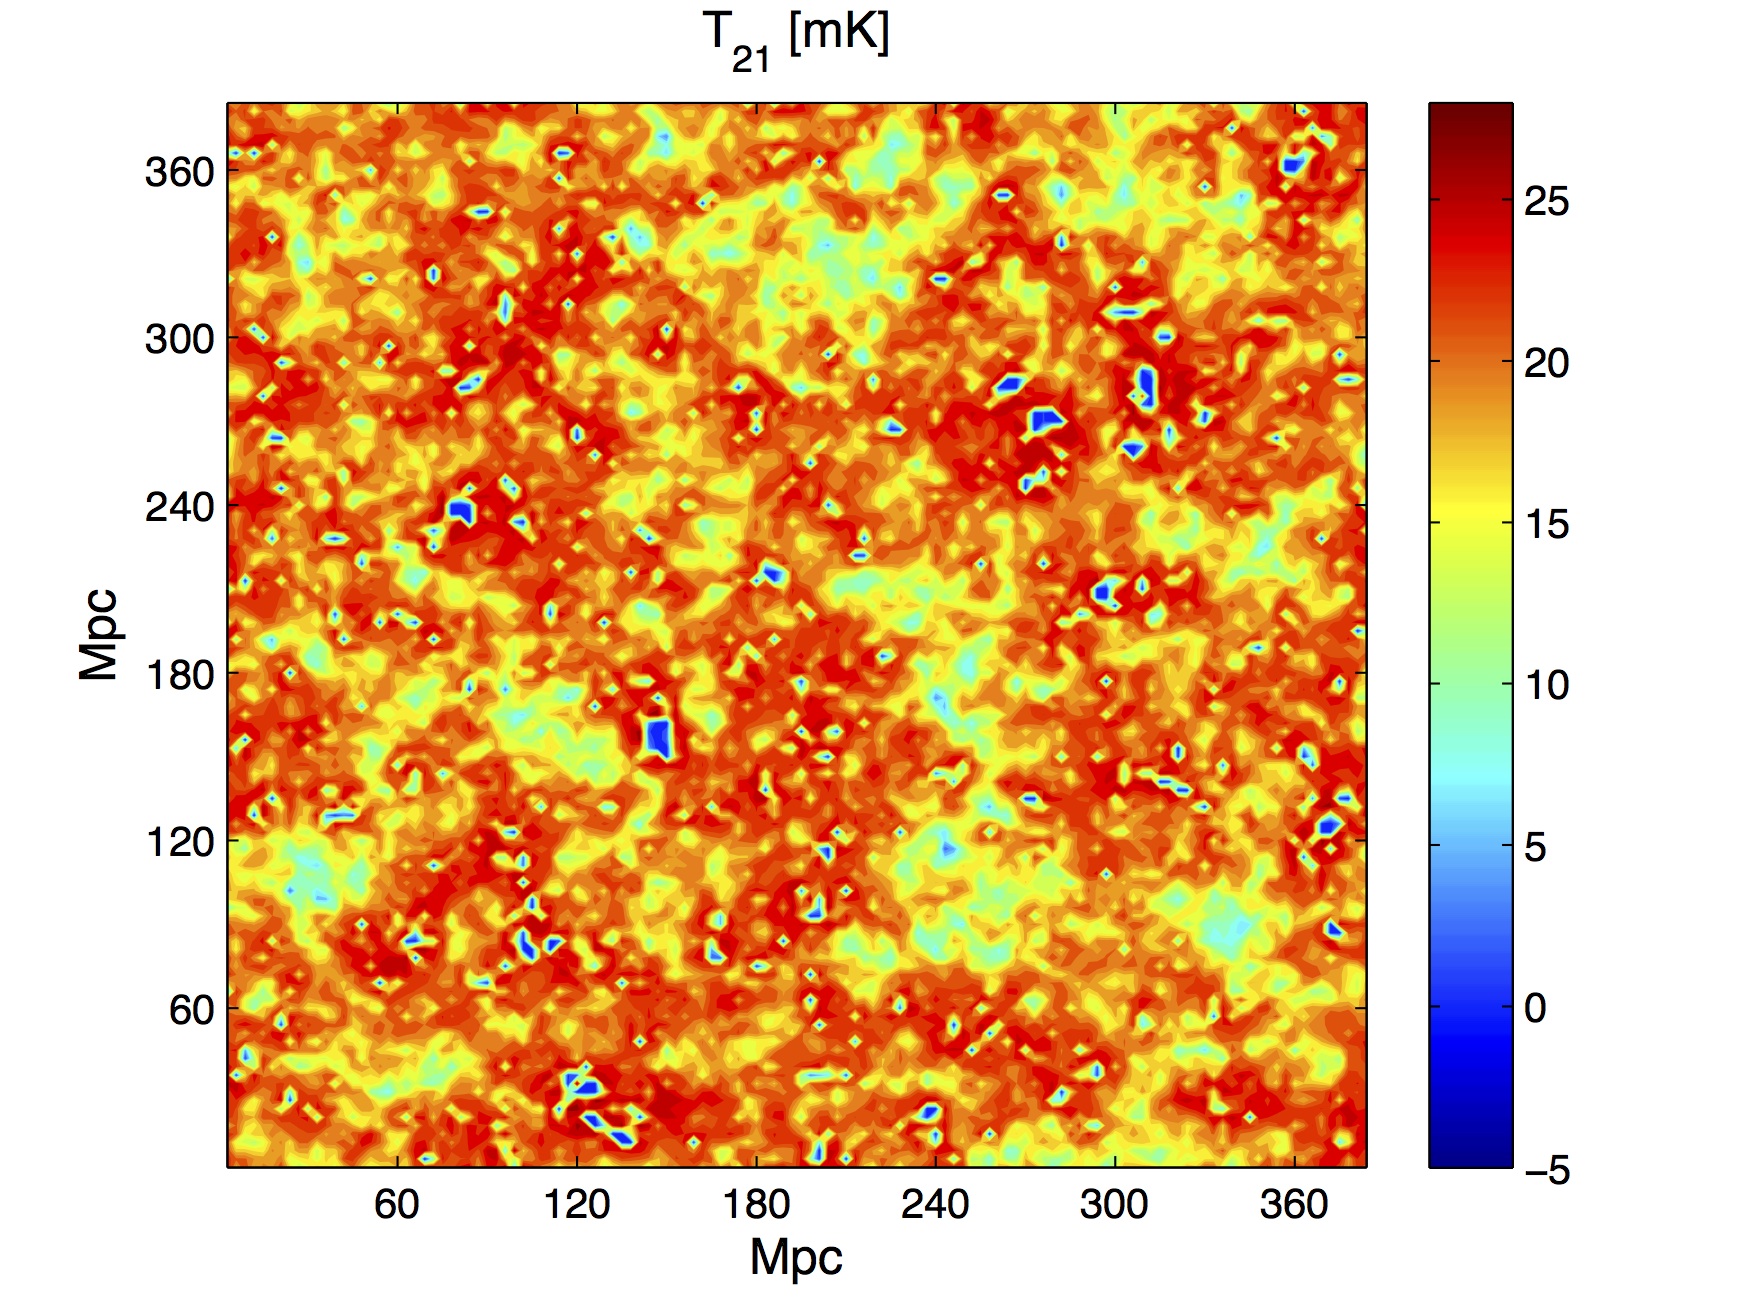
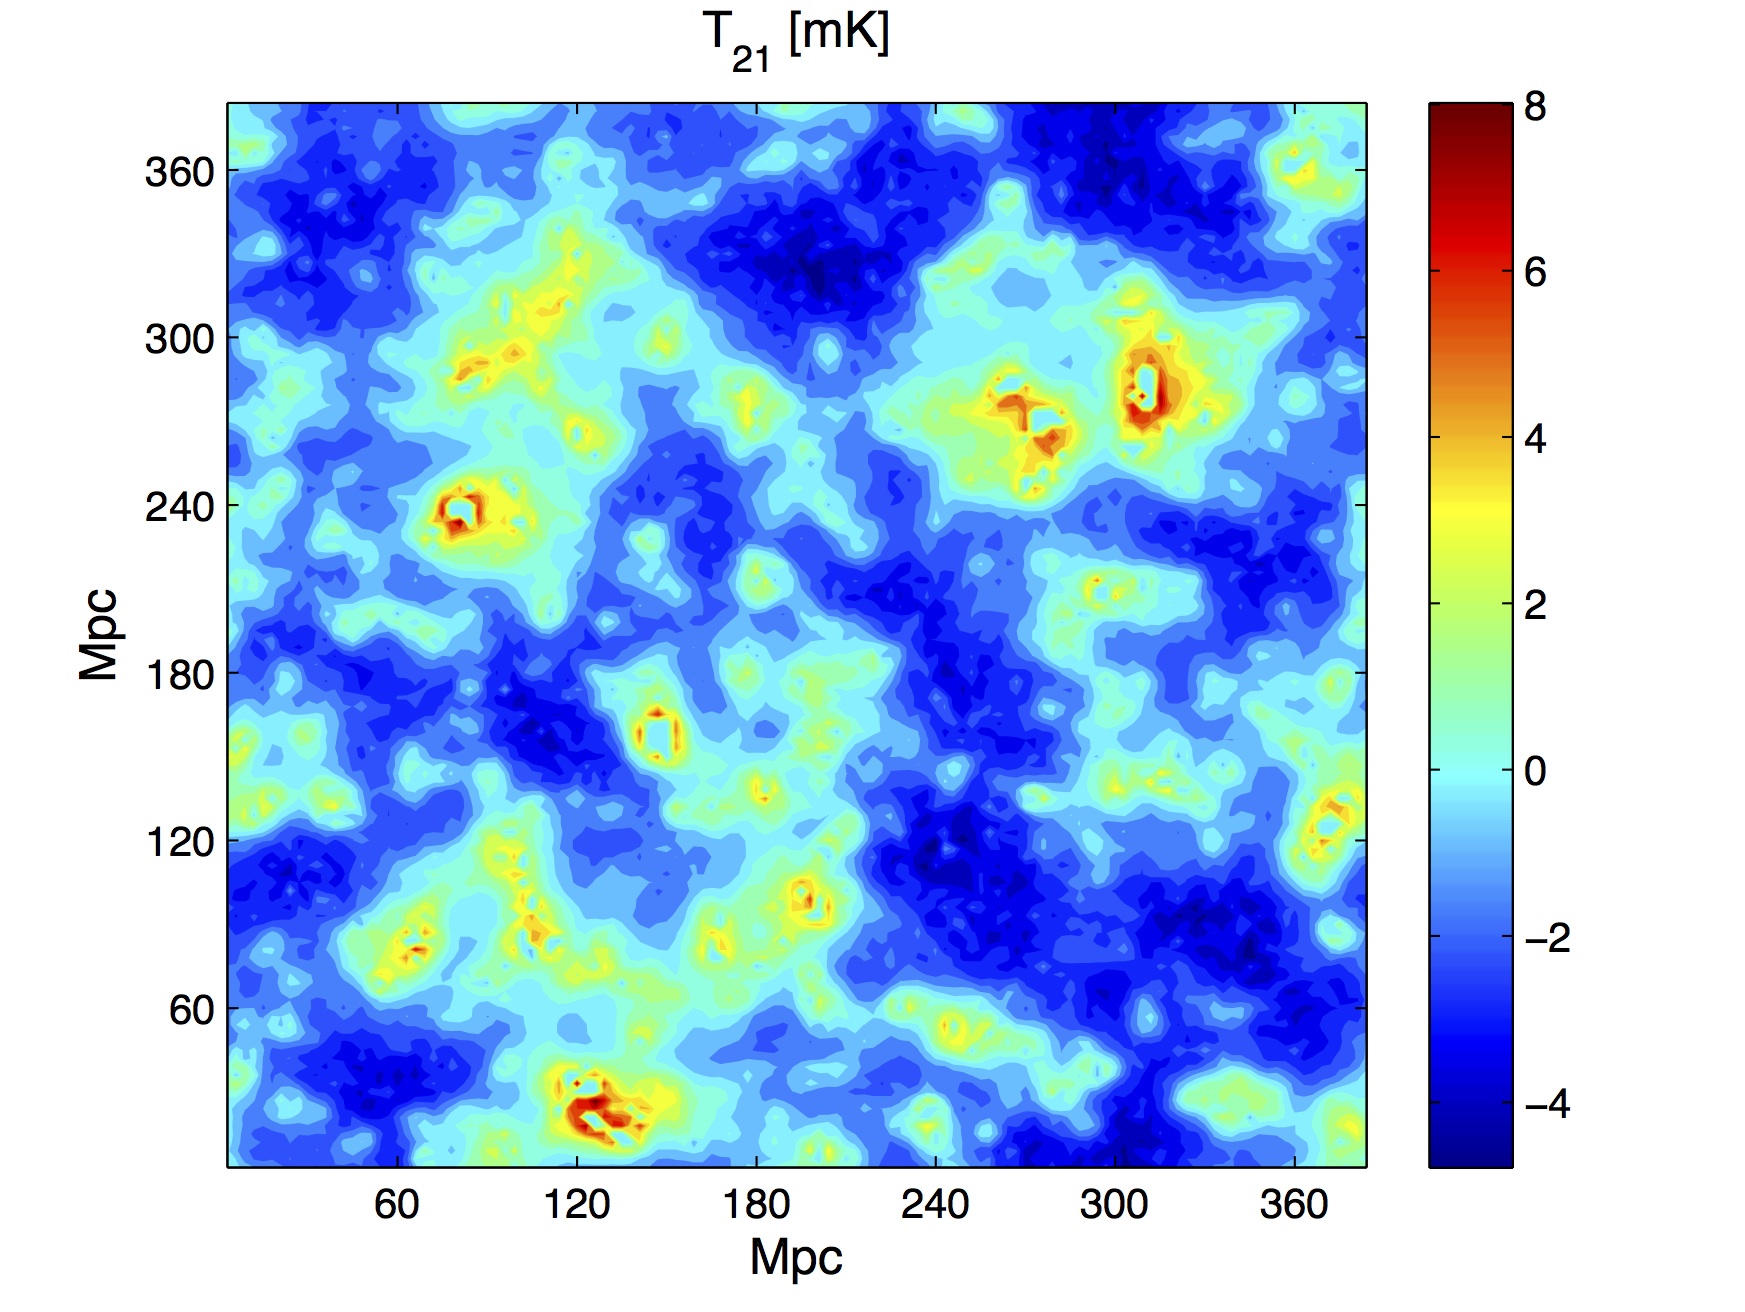
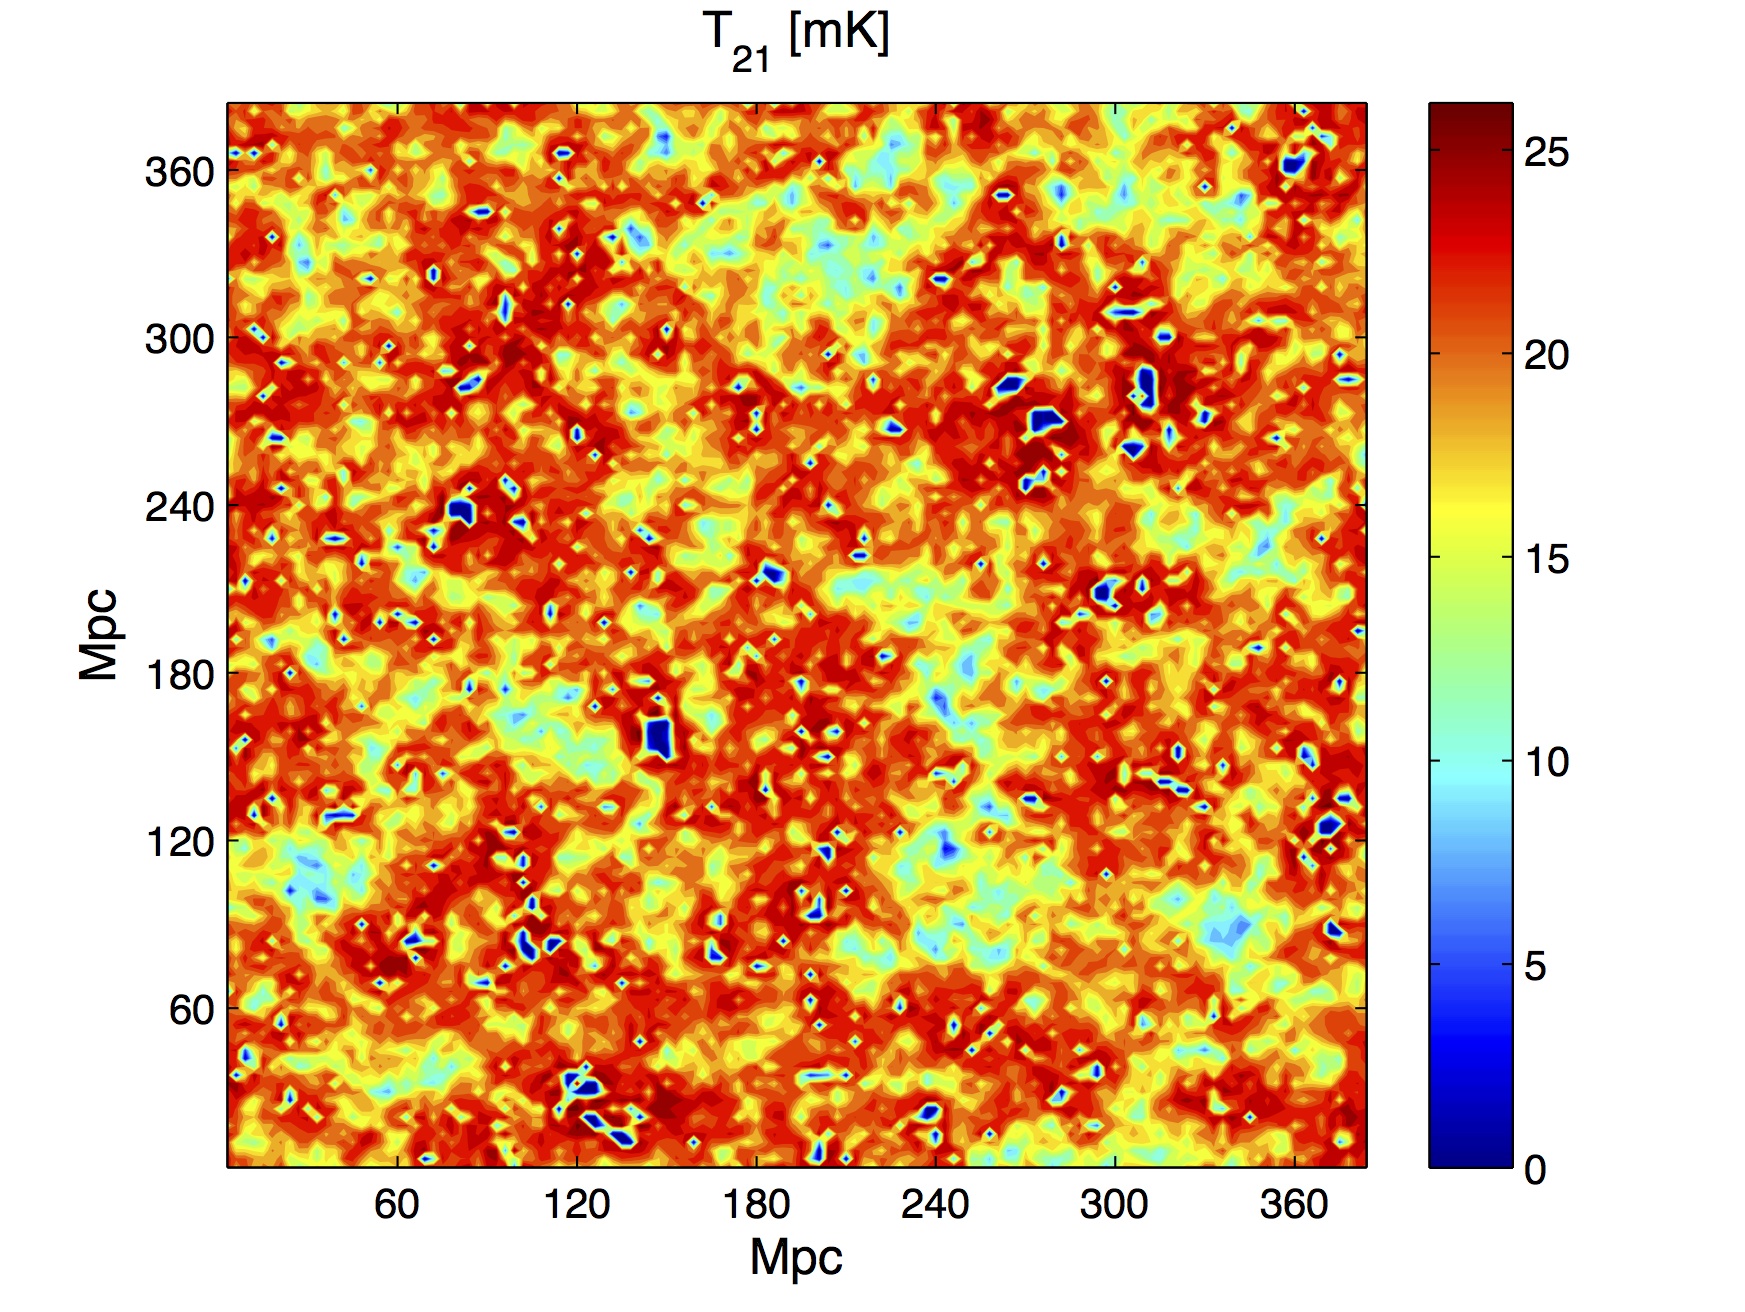
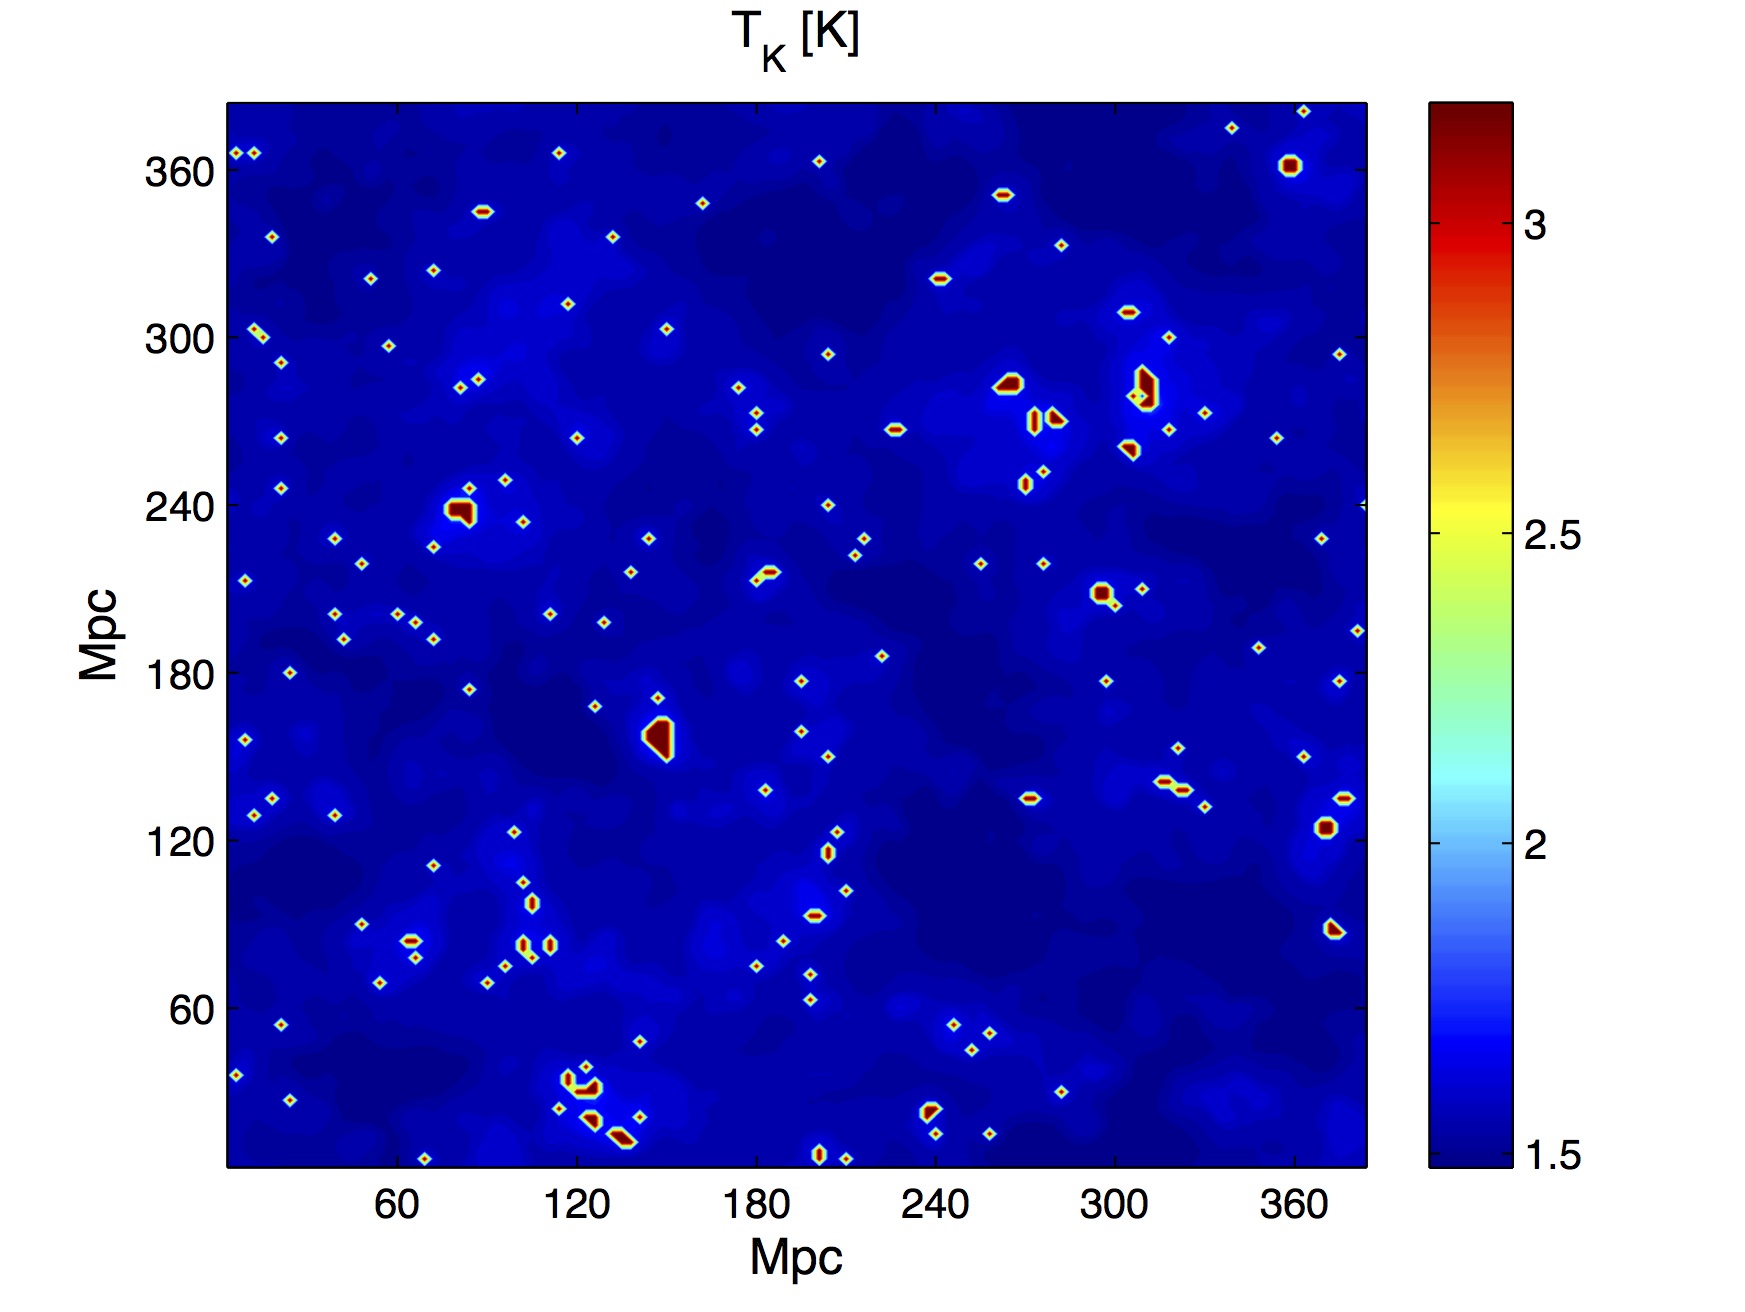
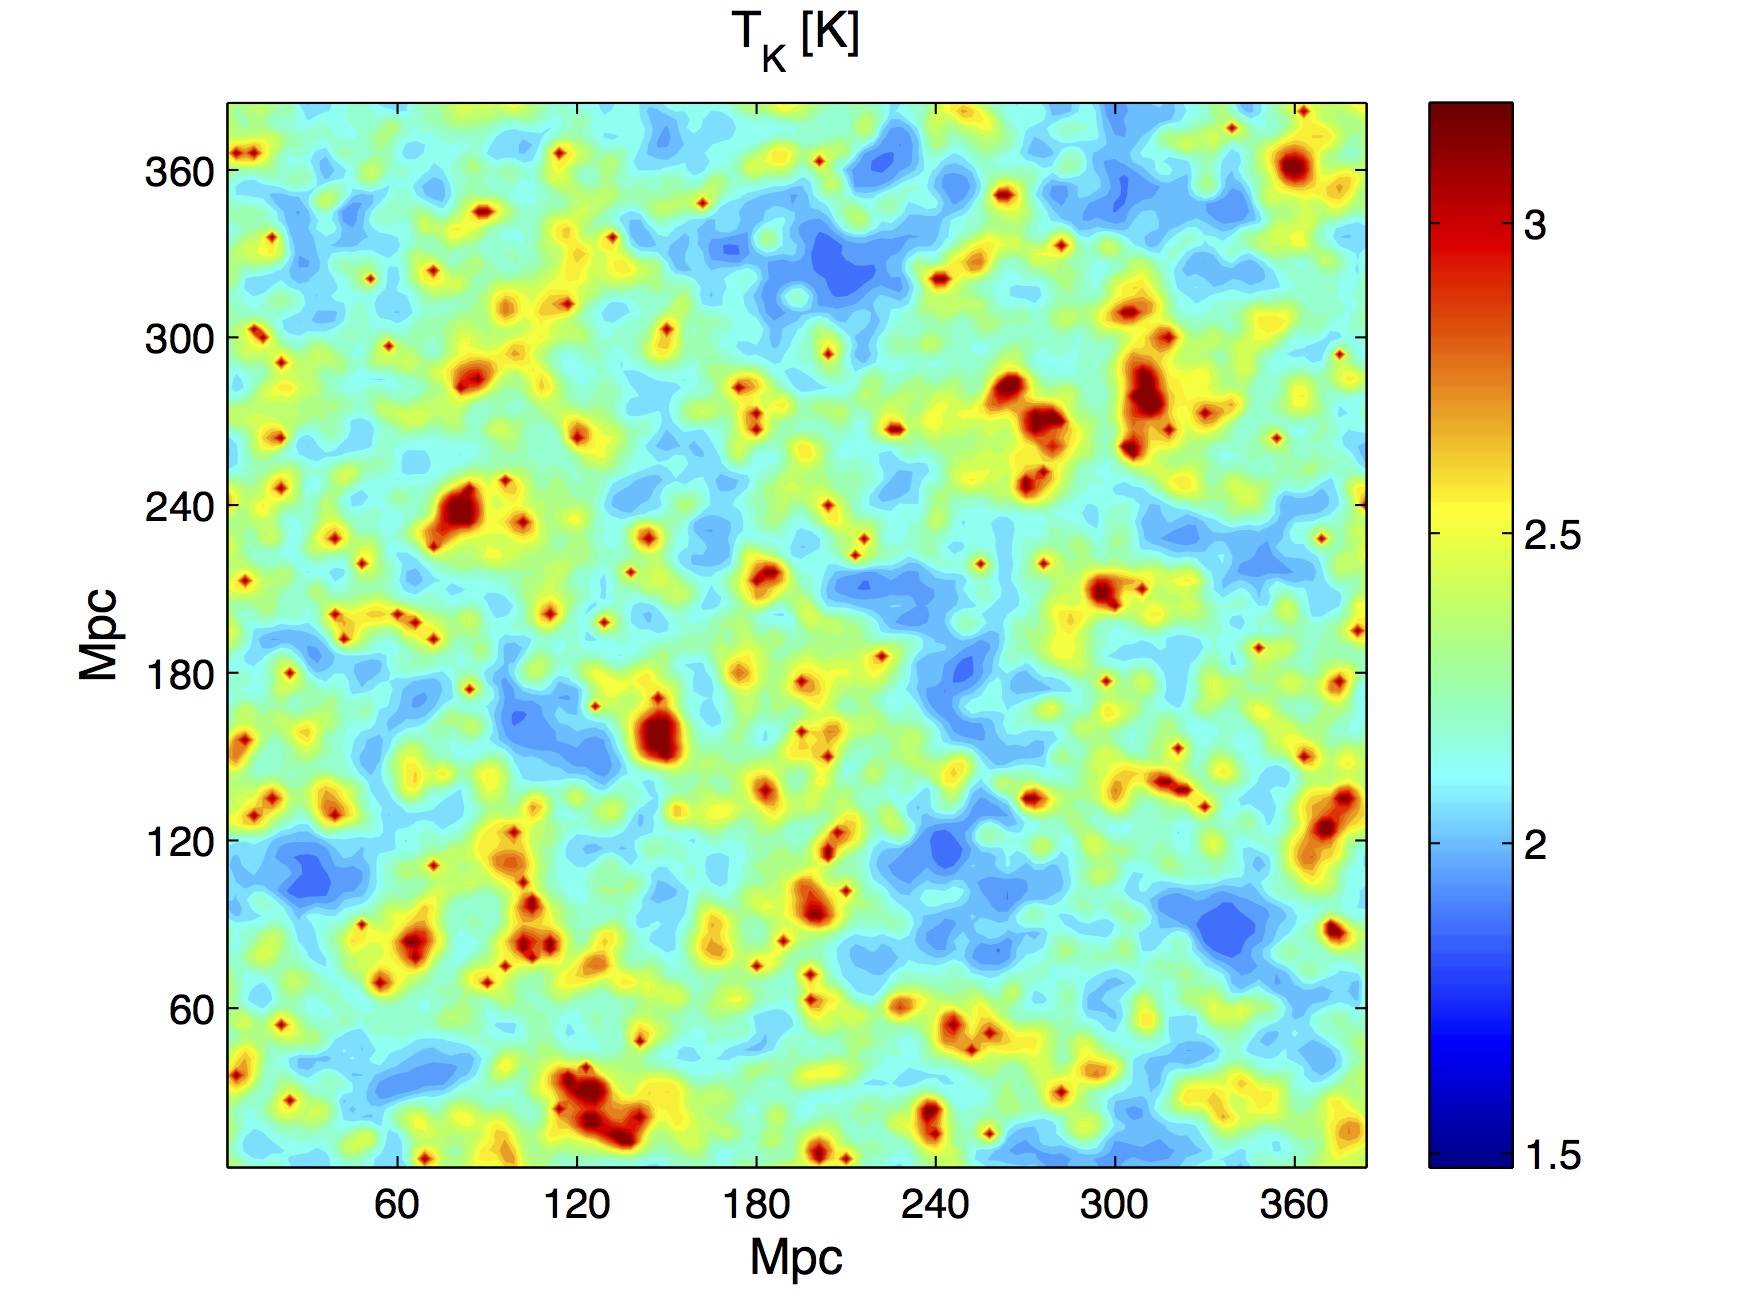
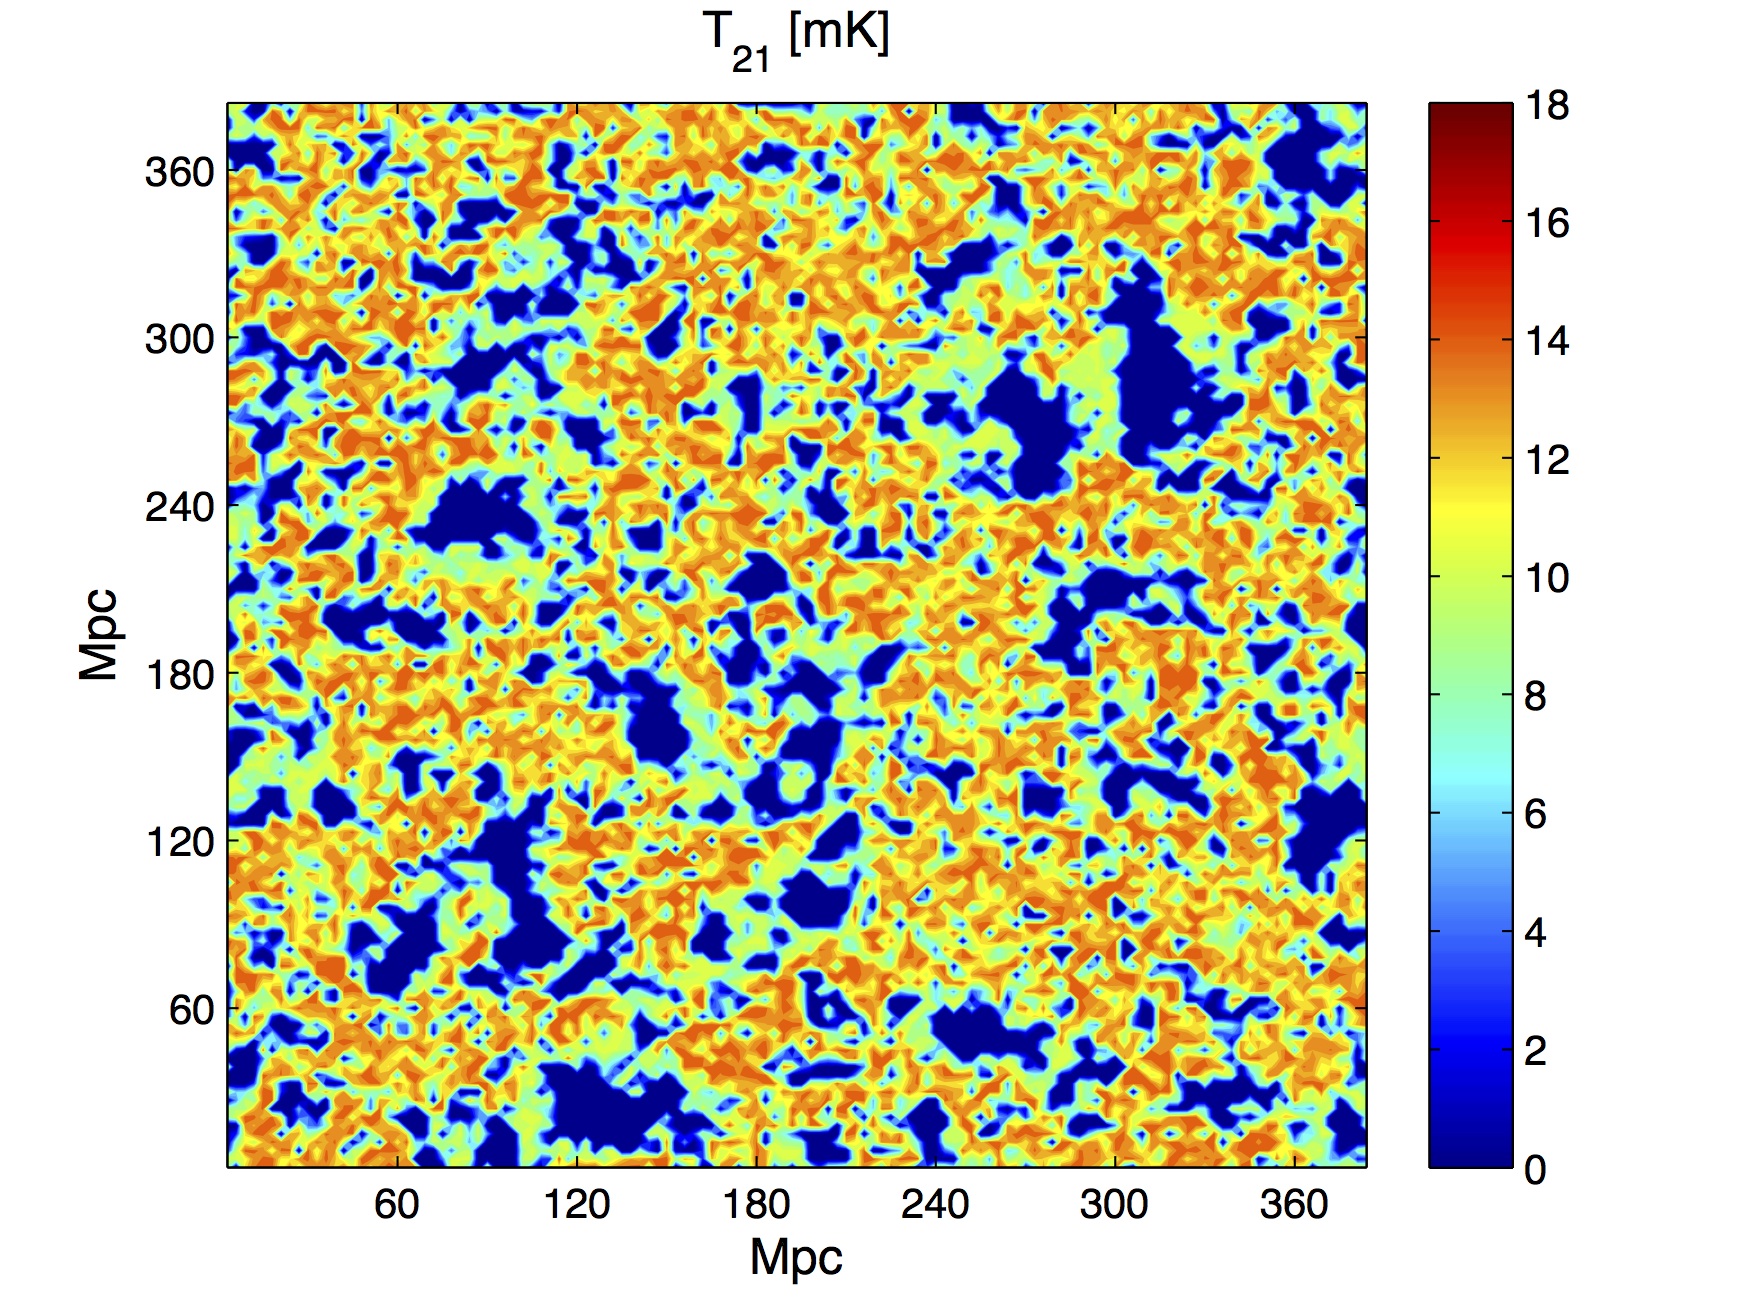
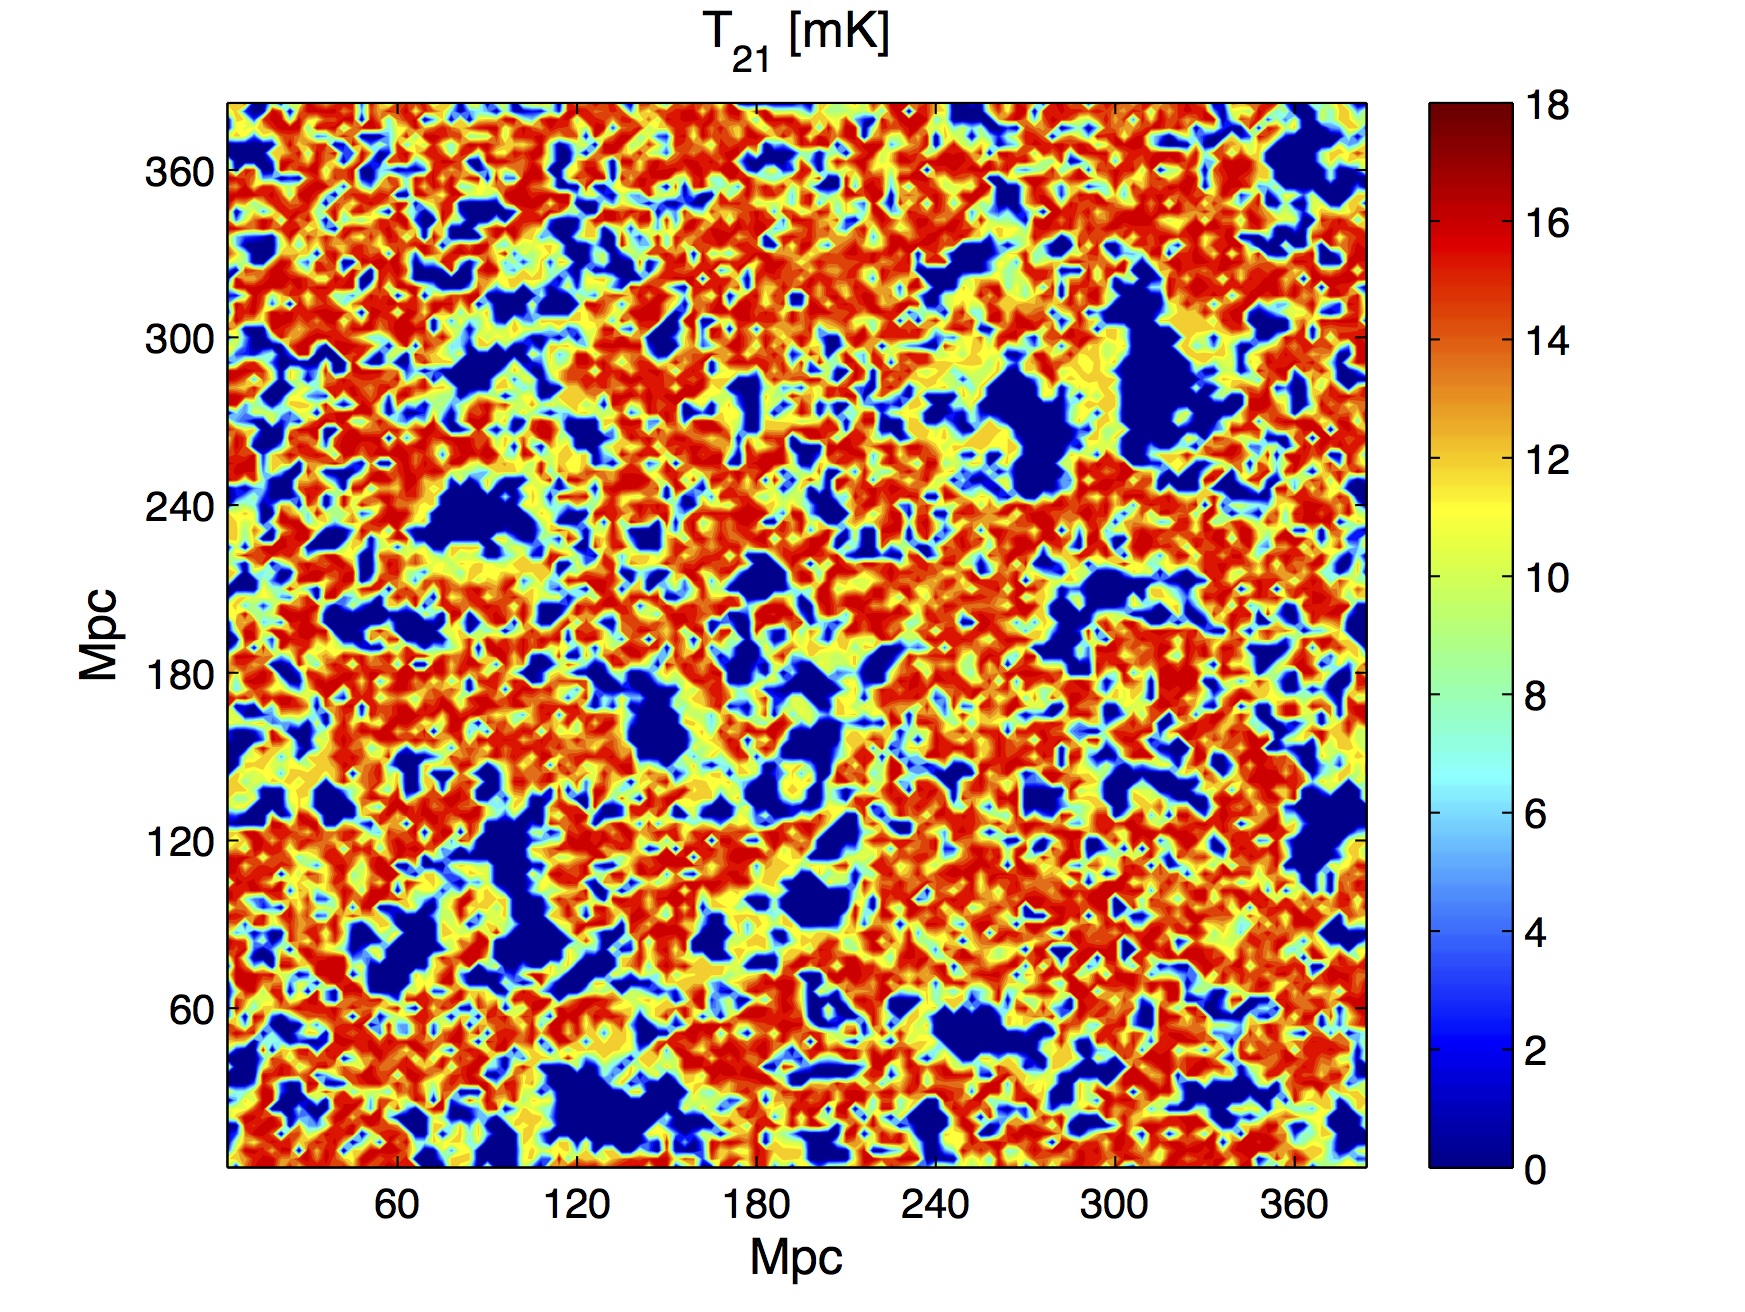
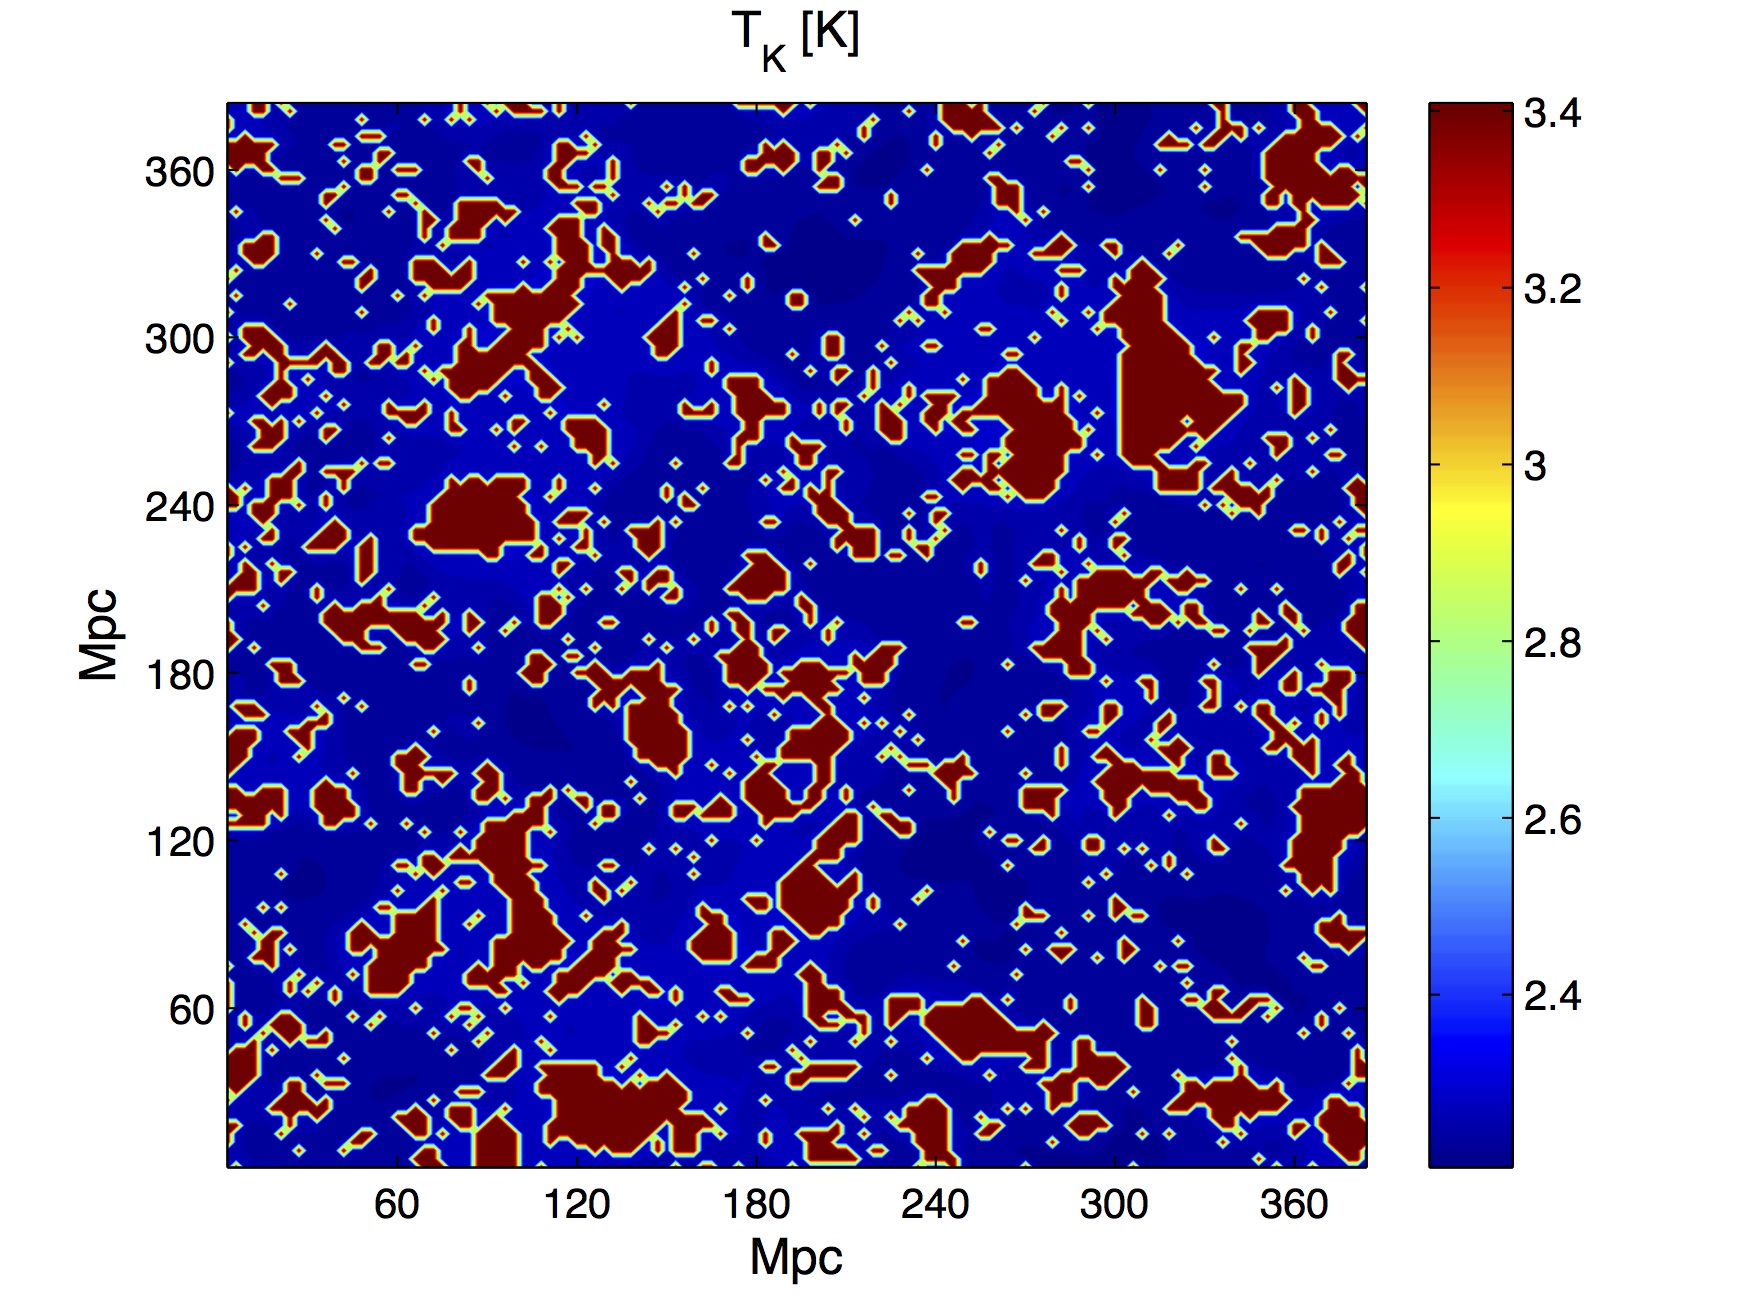
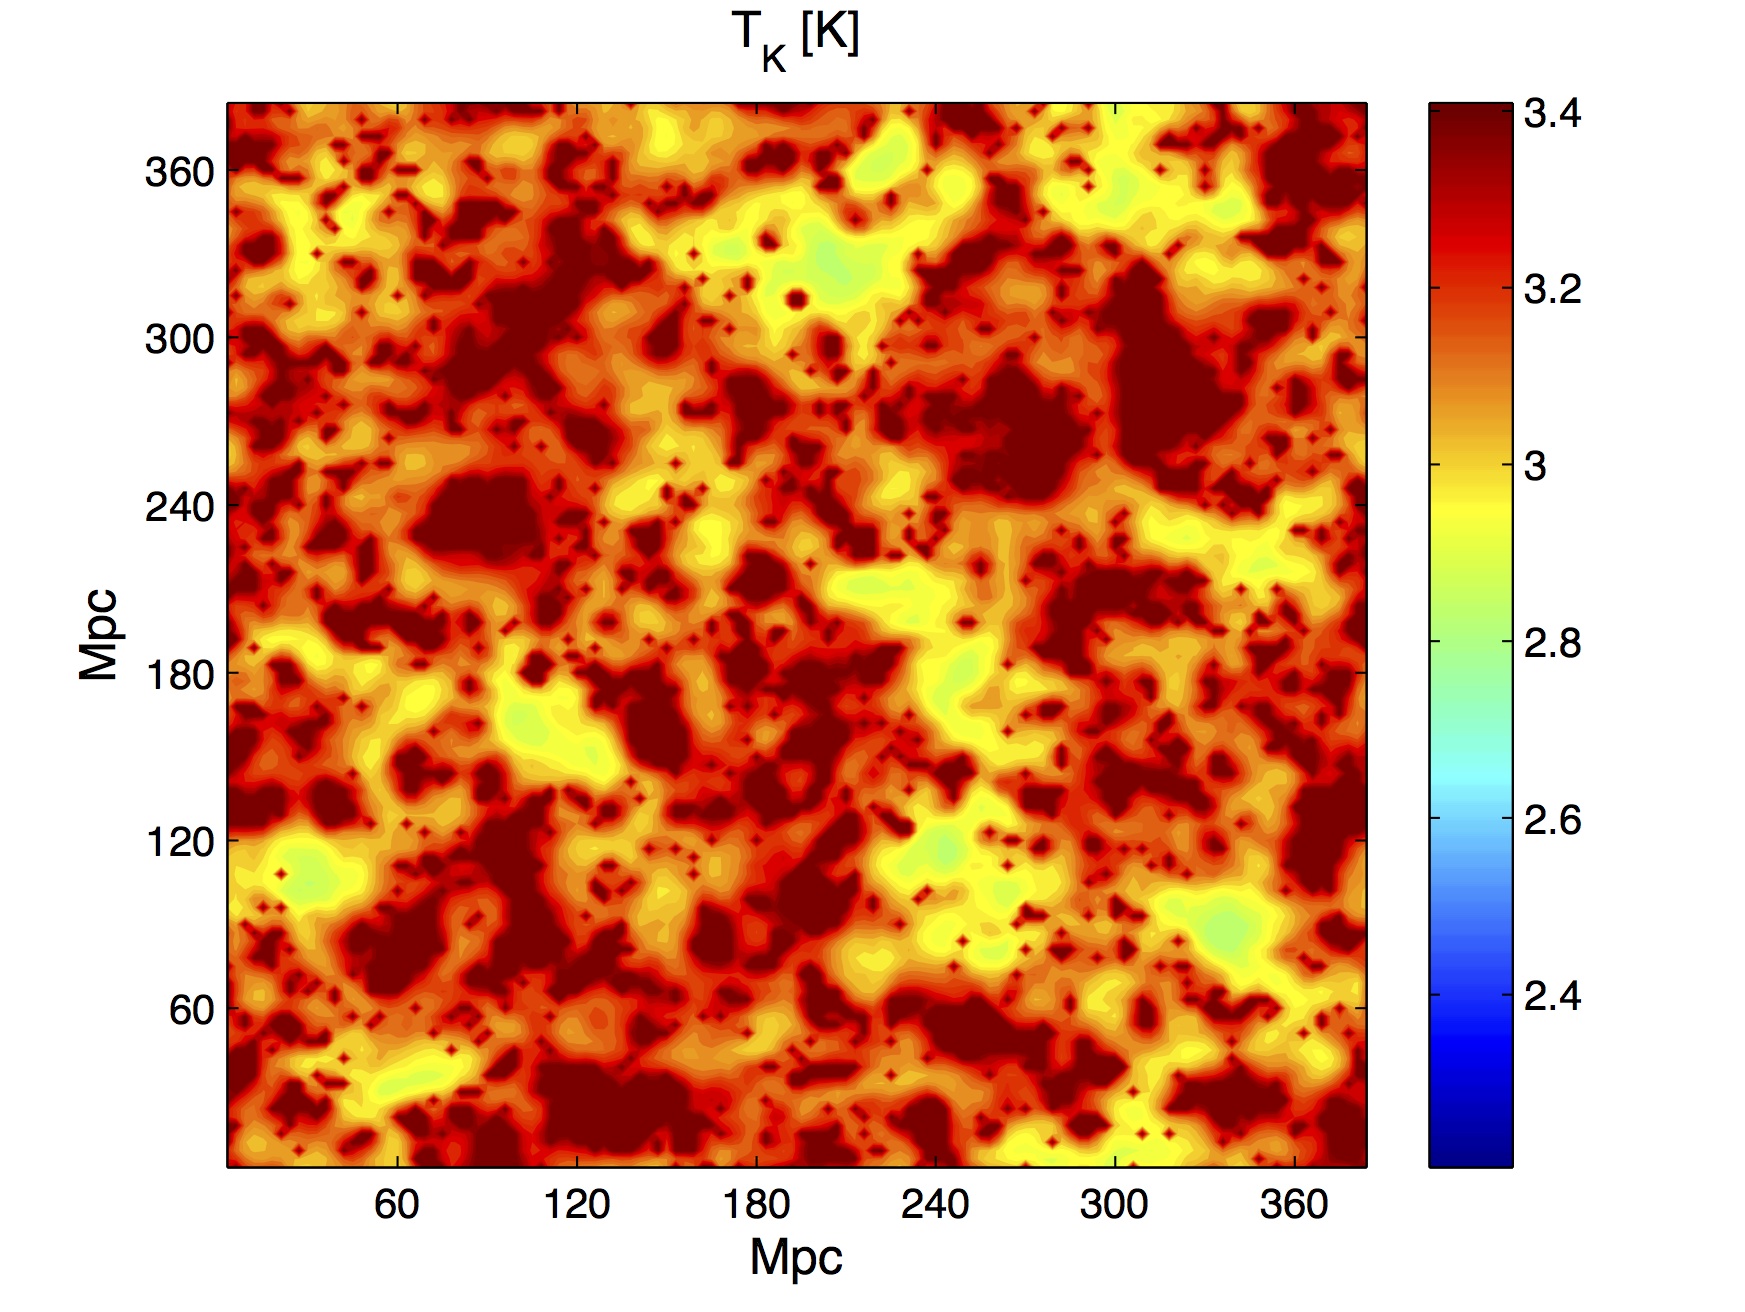
The two images show examples of predicted radio emission maps at an
early time in cosmic reionization, when 14% of the cosmic gas was in
ionized bubbles. The corresponding redshift in this model is 12.1
(which means that the Universe has expanded by a factor of 13.1 from
that early time - a cosmic age of 360 million years - until today's 14
billion year old Universe). The small ionized bubbles can be seen in
the blue corresponding to zero on the intensity scale (They are easy
to see in the right-hand image, where they are the only blue regions).
The time shown here corresponds (for the new prediction) to the key
heating moment noted above. Compared to the previous prediction, under
the new prediction the gas is colder (and so emits less, even showing
absorption - negative intensity), and the intensity map is much
more uniform and especially smooth (fuzzy) on small spatial scales.
Several international teams of radio astronomers are currently
competing to be the first to detect the radio waves emitted at 21 cm
by hydrogen in the early Universe (acronyms of some of the experiments
are LOFAR, MWA, PAPER, GMRT, EDGES, and the future SKA). If the key
moment of smooth 21 cm intensity is detected, this would confirm the
predicted scenario, and indirectly measure the average gas temperature
at that time as well as the properties of the X-ray radiation from
some of the earliest black holes.