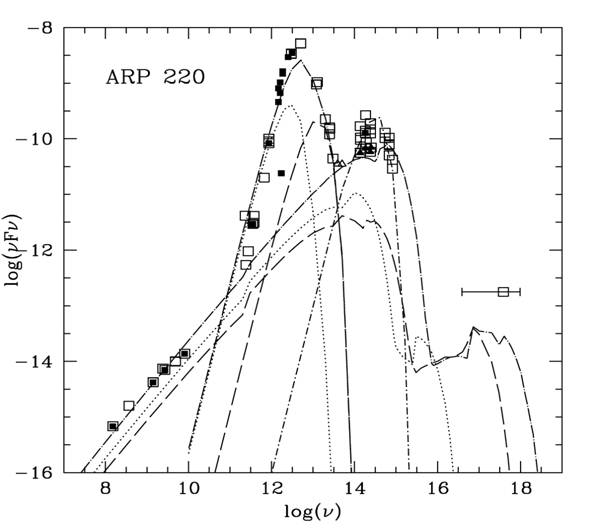
Figure 5: Arp 220 continuum spectrum. The data from
the NED (NASA Extragalactic Database) correspond to different apertures: up to
14 arc seconds: black squares; large apertures: white squares; integrated from maps:
large black squares. Dotted lines: model representing the underlying galaxy;
long-dashed lines: starburst; long dash-dot lines: AGN; dash-dotted line:
black-body (T=3000 K) representing the old star population [18].