SALTICAM Specifications
If you are familiar with the instrument, jump to Observer Specifics. If not, go to Basic Properties.
Basic Properties
|
Image Quality |
See SALTICAM Optical Design page. 0.3 arcsec (EE50), combined with SALT 0.6 arcsec (EE50), to give 0.67 arcsec image quality, independent of seeing. EE80 shall be no more than 0.5 arcsec. Distortion shall be less than 1 per cent. The mean plate scale shall be 107 micron/arcsec or 9.35 arcsec/mm within 1 per cent. |
|
Science Field of View |
8 arcmin in diameter |
|
Guide Star Field of View |
10 arcmin in diameter |
|
Wavelength range |
320 – 950 nm |
|
Filters |
8 position filter unit: UBVRI + ND + clear filters + short wavelength interference filters at 340 nm (FWHM 35 nm) and 380 nm (FWHM 40 nm) supplied |
|
CCD chips |
E2V Technologies 44-82 |
|
Format |
2048 x 4102 x 15 micron square pixels per chip |
|
Imaging area per chip |
30.7 x 61.5 mm2 imaging area per chip |
|
Readout capabilities |
2 readout amplifiers per chip |
|
Mosaicing |
2 x 1 mini-mosaic |
|
CTE |
better than 99.99% |
|
Full well |
164 and 172 k e-/pix (for CCDs SALT-01 and SALT-02 respectively) |
|
Dark current |
less than 1e-/pix/hr at 160 K |
|
Readout noise |
less than 3.0 e-/pix at 100 kHz (10.0 usec/pix) (slow readout) |
|
CCD Controller |
SDSU II (Leach) from Astronomical Research Camera Inc. |
|
Sensitivity |
Thinned, back-illuminated. Deep depletion silicon.
|
Instrument Efficiency
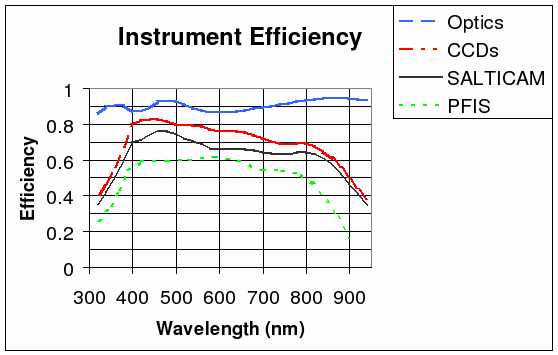
"Typical" instrument and system efficiencies are shown
in Fig. 1 and were calculated for the on-axis field position
using:
- Optics:
(i) No absorption in any of the lens material or cryostat window (CaF2, BaF2, fused Si); Absorption by Sylgard 184 at two doublet interfaces;
(ii) Reflection at 10 air-glass interfaces using the Spectrum Thin Films BBAR coating;
(iii) Reflection at 2 air-glass interfaces using a single layer of MgF2 coating (see the 3310AE0001 Optical Design Issue 2.7.doc for details).The reflection or absorption in any filter is not included.
- CCDs: Quantum efficiency as delivered.
Fig.1 shows SALTICAM efficiency as the product of the optics and the CCD curves. For reference, PFIS performance taken from Fig. 5 of the PFIS PDR Instrument Description Document is also shown.
 |
|
Figure 1. Instrument Efficiencies |
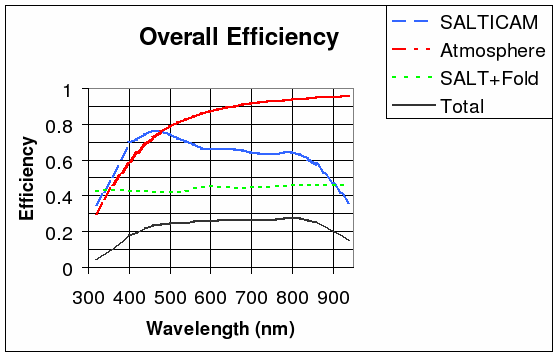
Fig. 2 shows overall efficiency based on:
- Atmosphere: The standard atmospheric extinction curve for Sutherland at a zenith distance of 37 degrees.
- SALT + Fold: This is the minimum throughput taken from the System specification and includes reflectivity of the SALT Primary Mirror and the spherical aberration corrector (SAC), the SAC central obscuration, four per cent light losses at the four surfaces of the ADC, and the reflectivity of the fold mirror using the Livermore coating performance as supplied by David Buckley.
- Total: In the bottom panel of Fig. 1 is the product of the SALTICAM, Atmosphere and SALT+Fold curves.
 |
|
Figure 2. Overall Efficiency |
Observer Specifics
|
QE: |
As delivered by E2V Technologies for each chip is as follows: |
||||||||||||||||||||||||||||||
|
|
| ||||||||||||||||||||||||||||||
|
Cosmetics: |
Delivered cosmetics for each chip are shown below: | ||||||||||||||||||||||||||||||
|
|
| ||||||||||||||||||||||||||||||
|
Gain: |
Gain is user selectable and dependent on selected readout speed: | ||||||||||||||||||||||||||||||
|
|
| ||||||||||||||||||||||||||||||
|
Prebinning: |
1 x 1 to 9 x 9, independently in each direction | ||||||||||||||||||||||||||||||
|
Readout speed: |
Frame transfer architecture: 0.10 sec frame transfer time 100-333 kHz (10-3.0 usec/pix). Observer specifies readout speed as "FAST" or "SLOW". | ||||||||||||||||||||||||||||||
|
Readout times: |
| ||||||||||||||||||||||||||||||
|
Windowing: |
Up to 10 windows (prefer not to specify for P-V phase) | ||||||||||||||||||||||||||||||
|
Fastest
windowed |
0.1 sec/sample with no dead time | ||||||||||||||||||||||||||||||
Count Rates And Signal-To-Noise For A Star With U=B=V=R=I=20
Using the overall “typical” efficiency shown in the bottom panel of Fig. 1, the area of each SALT mirror (8660 cm2) and count rates for point sources were calculated and are shown in the third column of the table below. Dark sky count rates are shown in the righthand column from measurements made recently at Sutherland by Dr. J. Menzies.
The photon rates are THEORETICAL. They will be updated with actual rates as soon as they are known. Note that these are “monochromatic” magnitudes.
Users can calculate signal-to-noise ratios by:
- integrating across the appropriate filter (multiplying by the full width half maximum of the filter at its peak transmission is a good start)
- calculating the number of square arcsec to include in the point source measurement and its associated sky subtraction
- calculating the sky contribution by multiplying this number by that in the righthand column of the table below, and then calculating the sky noise
- calculating the readout noise contribution
The PI apologises that users have to do these by hand. Ultimately the Exposure Time Calculator will be available.
|
Wavelength |
Photon Rates Per Sec (U=B=V=R=I=20) | ||
|
Point Source |
Sutherland Sky (No
Moon) | ||
|
(photon/sec/Ang) |
(Magnitudes) |
(photons/sec/Ang) | |
|
360 |
0.6 |
22.5 |
0.06 |
|
440 |
2.5 |
22.5 |
0.25 |
|
550 |
2.0 |
21.5 |
0.50 |
|
640 |
1.5 |
20.8 |
0.72 |
|
790 |
1.1 |
19.9 |
1.21 |
|
Filter |
FWHM |
Photon Rates in 1 sec from Point
Source |
Photon Rates in 1 sec from Sky (No
Moon) |
Effective Noise
|
Signal-To-Noise |
|
U |
700 |
420 |
132 |
39 |
10 |
|
B |
1000 |
2500 |
785 |
65 |
38 |
|
V |
900 |
1800 |
1410 |
65 |
27 |
|
R |
1500 |
2250 |
3393 |
82 |
27 |
|
I |
1500 |
1650 |
5702 |
91 |
18 |
Natural seeing at Sutherland has median EE80 of 1.7 arcsec. When combined with the SALT image quality requirement of EE80 of 0.9 arcsec and allowing for modest degradation (0.5 arcsec EE80) by SALTICAM, median image quality on the detector will have EE80 of about 2.0 arcsec, corresponding to pi square arcsec. Assuming one second exposures and 2 x 2 prebinning (30 micron or 0.28 arcsec pix: ~40 pix will be used in the measurement), count rates and signal-to-noise in 2 x 2 prebinned images through UBVRI filters for 3.14 square arcsec can then be calculated. The results are shown in the Table above.
List of TBC Issues
These “To Be Confirmed” items will be resolved when the limitations of the Leach CCD controller as well as the CCD chips are defined. The numbers given above are therefore current best estimates, must be considered as provisional and may improve or get worse. As an example, those familiar with ULTRACAM’s likely high time resolution capability will be curious as to why the SALTICAM detectors will take 0.1 sec to perform a frame transfer. This results simply from the larger size of the CCDs to be used in SALTICAM, compared to the E2V CCD 47-20s in ULTRACAM. Indications from E2V are that the CCDs can probably be clocked at a faster rate, but this remains to be verified.